Compare two Experiments
This tutorial will guide you through the process of building and comparing distinct
binaries of the same benchmark. As an example, we will be using an experiment comparing
two builds of the quicksilver benchmark, compiled with the gcc and intel
compiler variants on LLNL’s Ruby cluster.
Building Multiple Binaries
Create separate system instances. Parameters could include: compiler, mpi, etc. In this case, we are changing the compiler variant
benchpark system init --dest=ruby-gcc llnl-cluster cluster=ruby compiler=gcc
benchpark system init --dest=ruby-intel llnl-cluster cluster=ruby compiler=intel
Creating experiment ramble.yaml
Create the experiment description Parameters could include: version, scaling, etc.
In this example, we are only changing the compiler. Because all experiment variables
will be the same, we only need to generate a single experiment description. This command
initializes a quicksilver experiment configuration in the quicksilver directory. We
are doing weak scaling with openMP, and measuring MPI metrics with Caliper.
benchpark experiment init --dest=quicksilver-gcc ruby-gcc quicksilver caliper=mpi
+weak +openmp
benchpark experiment init --dest=quicksilver-intel ruby-intel
quicksilver caliper=mpi +weak +openmp
Note
Running a benchmark repeatedly will overwrite the existing output. A way to prevent
this is to create multiple duplicate experiments, changing the experiment name
(--dest=quicksilver, --dest=quicksilver2).
Running multiple experiments
Now that both the system and experiment parameters have been defined, we can setup each experiment directory. This step will install the binary, and create the execute_experiment shell script
$ benchpark setup ruby-gcc/quicksilver-gcc workspace
$ benchpark setup ruby-intel/quicksilver-intel workspace
Now, we generate an execute_experiment shell script for each run, and install the benchmark along with all dependencies
$ ramble --workspace-dir workspace/quicksilver-gcc/ruby-gcc/workspace workspace setup
$ ramble --workspace-dir workspace/quicksilver-intel/ruby-intel/workspace workspace setup
Completing these steps will result in the following structure
experiments_root/
     ramble/
     spack/
     quicksilver-gcc/
         ruby-gcc/
             workspace/
                 experiments/
                     ..../
                     execute_experiment
     quicksilver-intel/
         ruby-intel/
             workspace/
                 experiments/
                 ..../
                 execute_experiment
Verifying build details, differences between builds
Benchpark offers two ways to double check that each binary has built according to the specifications:
$ spack find -L quicksilver

 -- linux-rhel8-sapphirerapids / gcc@12.1.1 ----------------------
 fubnce7wzgjxhkim2cylijt4cbpfhxi6 quicksilver@master

 -- linux-rhel8-sapphirerapids / intel@2021.6.0-classic ----------
 qwev4yodp2joikf2oxvlo224ksjcqve3 quicksilver@master
 ==> 2 installed packages
This output shows each installed binary, along with their associated hashes. We can use these hashes to independently double-check the details of each build. In this case, we can check the quicksilver spec, along with its dependencies by running spack spec for each binary
spack spec quicksilver/{hash}
Each spec will generate a dependency tree, showing which variants and compilers were used for each compiler. The output from both commands is below
$ spack spec quicksilver/fubnce7wzgjxhkim2cylijt4cbpfhxi6

 [+]  quicksilver@master%gcc@12.1.1~cuda+mpi+openmp build_system=makefile arch=linux-rhel8-sapphirerapids
 [+]      ^gcc-runtime@12.1.1%gcc@12.1.1 build_system=generic arch=linux-rhel8-sapphirerapids
 [e]      ^glibc@2.28%gcc@12.1.1 build_system=autotools arch=linux-rhel8-sapphirerapids
 [e]      ^gmake@4.2.1%gcc@12.1.1~guile build_system=generic patches=ca60bd9,fe5b60d arch=linux-rhel8-sapphirerapids
 [e]      ^mvapich2@2.3.7-gcc1211%gcc@12.1.1~alloca~cuda~debug~hwloc_graphics~hwlocv2+regcache+wrapperrpath build_system=autotools ch3_rank_bits=32 fabrics=mrail file_systems=auto patches=d98d8e7 process_managers=auto threads=multiple arch=linux-rhel8-sapphirerapids

$ spack spec quicksilver/qwev4yodp2joikf2oxvlo224ksjcqve3

 [+]  quicksilver@master%intel@2021.6.0-classic~cuda+mpi+openmp build_system=makefile arch=linux-rhel8-sapphirerapids
 [e]      ^glibc@2.28%intel@2021.6.0-classic build_system=autotools arch=linux-rhel8-sapphirerapids
 [e]      ^gmake@4.2.1%intel@2021.6.0-classic~guile build_system=generic patches=ca60bd9,fe5b60d arch=linux-rhel8-sapphirerapids
 [e]      ^mvapich2@2.3.7-intel202160classic%intel@2021.6.0-classic~alloca~cuda~debug~hwloc_graphics~hwlocv2+regcache+wrapperrpath build_system=autotools ch3_rank_bits=32 fabrics=mrail file_systems=auto patches=d98d8e7 process_managers=auto threads=multiple arch=linux-rhel8-sapphirerapids
Notice that each dependency tree differs in the compilers used (gcc@12.1.1 vs. intel@2021.6.0)
This can also be done in a single command by the diffBuildSpecs.py script (see
Compare Build Specs).
spack-python lib/scripts/diffBuildSpecs.py quicksilver/{hash1} quicksilver/{hash2}
Note
spack-python is required to import the spack libraries needed for this script.
It will automatically be added to your $PATH when you run benchpark setup
....
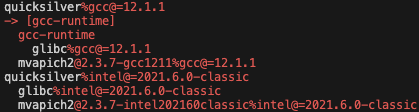
The output shows the quicksilver build tree twice: the first hash compared to the second
hash, followed by the second hash compared to the first hash. The first quicksilver spec
tree highlights additional specs present in quicksilver/fubnce7 and not the other
hash, e.g. gcc-runtime. Specs that are in both trees are white with the version
differences between the specs highlighted in red, e.g. glibc.
$ spack-python lib/scripts/diffBuildSpecs.py --truncate quicksilver/fubnce7wzgjxhkim2cylijt4cbpfhxi6 quicksilver/qwev4yodp2joikf2oxvlo224ksjcqve3
Running Experiments
To launch the experiments in separate job allocations, run the following commands:
ramble --workspace-dir workspace/quicksilver/ruby-gcc/workspace on
ramble --workspace-dir workspace/quicksilver/ruby-intel/workspace on
Collecting FOMs
Most benchmarks within benchpark generate a figure of merit, which is a measure of performance. We can analyze the figure of merit by running the following:
ramble --workspace-dir workspace/quicksilver/ruby-gcc/workspace workspace analyze
ramble --workspace-dir workspace/quicksilver/ruby-intel/workspace workspace analyze
Note
An example bash script that automates the building and running of this analysis on
the LLNL Dane cluster is located at
benchpark/docs/examples/compare_experiment_builds/compareExperimentBuilds.sh.
Analyzing Caliper Data with Thicket
Enabling the Caliper modifier (see Benchpark Modifiers) gives us a much more detailed picture about any performance differences, beyond looking at runtimes we can generate a calltree profile to see which functions are contributing to a performance difference.
The Caliper .cali files are automatically generated in the experiment directory. To
further analyze the caliper data, Thicket can be used to view the calltree and generate
plots:
import thicket as th

tk = th.Thicket.from_caliperreader(["experiment_name1.cali"])

print(tk.tree(metric_column="time"))

tk.metadata.plot(x="mpi.world.size", y="FOM", kind="scatter")
For more information on Caliper and Thicket, refer to https://software.llnl.gov/Caliper/ and https://thicket.readthedocs.io/en/latest/,