Tutorial: Benchpark 101
This tutorial will guide you through using Benchpark to run a strong scaling experiment with the Kripke benchmark on an AWS instance.
It was presented as part of the HPCIC Tutorial Series on September 3, 2025. The event was an online half-day tutorial along with Ramble.
Full citation: Pearce, O., Scott, A., Becker, G., Haque, R., Hanford, N., Brink, S., Jacobsen, D., Poxon, H., Domke, J., & Gamblin, T. (2023, November 12–17). Towards Collaborative Continuous Benchmarking for HPC.
By the end of this tutorial, you will be able to use Benchpark to:
Initialize a system configuration and experiment configuration
Build and run a scaling experiment
Perform pre-defined performance analysis on the results of the scaling experiment
Prerequisites
Access to a terminal with Benchpark installed (provided automatically by the infrastructure in our Benchpark Tutorial repository)
Basic familiarity with command-line interfaces
Step 1: Verify Benchpark Installation
First, ensure Benchpark is installed and working correctly by running:
benchpark --version
You should see a version number like 0.1.0.
Step 2: Explore Available Benchmarks and Experiments
Next, list all available benchmarks and experiments in Benchpark by running:
benchpark list experiments
You should see an output like:
Experiments - BENCHMARK+PROGRAMMING_MODEL+SCALING
    ad+[mpi]
    amg2023+[openmp|cuda|rocm|mpi]+[strong|weak|throughput]
    babelstream+[openmp|cuda|rocm]
    genesis+[openmp|mpi]
    gpcnet+[mpi]
    gromacs+[openmp|cuda|rocm|mpi]
    hpcg+[openmp|mpi]+[strong|weak]
    hpl+[openmp|mpi]+[strong|weak]
    ior+[mpi]+[strong|weak]
    kripke+[openmp|cuda|rocm|mpi]+[strong|weak|throughput]
    laghos+[cuda|rocm|mpi]+[strong]
    lammps+[openmp|cuda|rocm|mpi]+[strong]
    md-test+[mpi]+[strong]
    mpi-pingpong
    osu-micro-benchmarks+[cuda|rocm|mpi]
    phloem+[mpi]
    quicksilver+[openmp|mpi]+[strong|weak]
    qws+[openmp|mpi]
    raja-perf+[openmp|cuda|rocm|mpi]+[strong|weak|throughput]
    remhos+[cuda|rocm|mpi]+[strong]
    salmon-tddft+[openmp|mpi]
    saxpy+[openmp|cuda|rocm|mpi]
    smb+[mpi]
    stream+[mpi]
From this output, you can see that Benchpark experiments are specified
using Spack-like conventions (e.g., ~, +). For example, the spec
kripke describes an experiment using the Kripke benchmark
running on a single node.
Additionally, you can get only the benchmarks implementing a particular
experiment by adding --experiment <experiment_name> to the above command.
For example, to get only CUDA benchmarks, run:
benchpark list experiments --experiment cuda
You should see the following:
Experiments - BENCHMARK+PROGRAMMING_MODEL+SCALING
    amg2023+[openmp|cuda|rocm|mpi]+[strong|weak|throughput]
    babelstream+[openmp|cuda|rocm]
    gromacs+[openmp|cuda|rocm|mpi]
    kripke+[openmp|cuda|rocm|mpi]+[strong|weak|throughput]
    laghos+[cuda|rocm|mpi]+[strong]
    lammps+[openmp|cuda|rocm|mpi]+[strong]
    osu-micro-benchmarks+[cuda|rocm|mpi]
    raja-perf+[openmp|cuda|rocm|mpi]+[strong|weak|throughput]
    remhos+[cuda|rocm|mpi]+[strong]
    saxpy+[openmp|cuda|rocm|mpi]
Note
For all benchmarks, the default experiment is +mpi only without scaling. For Kripke,
we specify the strong scaling mpi experiment on the command line using kripke
+strong as shown in Step 4 (+mpi is implied).
Step 3: Initialize Your System Description
Next, initialize the description of the AWS system by running the commands below:
cd benchpark
benchpark system init --dest=hpc-tutorial aws-tutorial instance_type=c7i.12xlarge
The benchpark system init command generates configuration
files that describe the system on which you are running. The system is
specified in a system specification (system.py). In the command above, the spec (i.e., aws-tutorial instance_type=c7i.12xlarge)
defines a system running with our tutorial infrastructure on AWS that uses the c7i.12xlarge instance type.
After running the command above, you should see the following files in the hpc-tutorial directory:
system_id.yaml: a Benchpark configuration file that contains high-level metadata about the systemsoftware.yaml: a Ramble configuration file specifying the default packages to use for software like compilers and MPIvariables.yaml: a Ramble configuration file defining variables that are needed for job script generation and scheduling (e.g., type of scheduler, number of cores per node)auxiliary_software_files/compilers.yaml: a Spack configuration file defining available compilers on the systemauxiliary_software_files/packages.yaml: a Spack configuration file defining available software on the system
Step 4: Initialize Your Experiment
Next, initialize the Kripke strong scaling experiment used in this tutorial by running:
benchpark experiment init --dest=kripke-benchmark --system=hpc-tutorial kripke +strong caliper=time,mpi
Similar to benchpark system init, the benchpark experiment init command generates
the Ramble configuration file to describe the experiment to be run. The experiment is specified
in an experiment specification (experiment.py). In the command above, the spec (i.e., kripke +strong caliper=time,mpi)
defines a strong-scaling experiment running Kripke with the performance
measurement tool known as Caliper enabled to collect performance metrics. The
caliper=time,mpi specification enables execution time measurement and MPI library
instrumentation.
After running the command above, you should see a Ramble configuration file
(ramble.yaml) in the kripke-benchmark directory.
Step 5: Setup Your Benchpark Workspace
After initializing the system description and experiment, setup a Benchpark workspace by running:
benchpark setup kripke-benchmark/ wkp/
This command takes the configuration files stored in the output directories of benchpark experiment init (i.e., kripke-benchmark/)
and benchpark system init (i.e., hpc-tutorial/) and combines them to generate a Benchpark workspace.
A Benchpark workspace contains everything that Benchpark, Ramble, and Spack need to build and run your experiment, including:
Clones of Spack and Ramble
A
setup.shscript that calls Spack and Ramble’s setup scriptsA Ramble workspace
To start using your Benchpark workspace, run:
. /home/jovyan/benchpark/wkp/setup.sh
Step 6: Build Software Dependencies and Generate Experiment Files
Next, build any necessary software and generate all necessary files for the Kripke scaling experiment by running:
ramble \
--workspace-dir /home/jovyan/benchpark/wkp/kripke-benchmark/hpc-tutorial/workspace \
workspace setup
This command does two things. First, it builds all necessary software using Spack. Building the software may take a while to complete, depending
on how many external packages are contained in the system definition from Step 3. For this tutorial, it should take roughly 2 minutes.
Second, this command generates batch scripts (e.g., submission scripts) for
executing the experiment.
For each run in the experiment, a directory containing the files necessary for the run will be
created under /home/jovyan/benchpark/wkp/kripke-benchmark/hpc-tutorial/workspace/experiments/kripke/kripke. If the command is successful, you should see something like:
==> Streaming details to log:
==>   /home/jovyan/benchpark/wkp/kripke-benchmark/hpc-tutorial/workspace/logs/setup.2025-07-09_18.08.23.out
==>   Setting up 4 out of 4 experiments:
==> Experiment #1 (1/4):
==>     name: kripke.kripke.kripke_kripke_single_node_strong_scaling_caliper_time_mpi_2_2_1_64_64_32_64_1_128_128_4_4
==>     root experiment_index: 1
==>     log file: /home/jovyan/benchpark/wkp/kripke-benchmark/hpc-tutorial/workspace/logs/setup.2025-07-09_18.08.23/kripke.kripke.kripke_kripke_single_node_strong_scaling_caliper_time_mpi_2_2_1_64_64_32_64_1_128_128_4_4.out
==>   Returning to log file: /home/jovyan/benchpark/wkp/kripke-benchmark/hpc-tutorial/workspace/logs/setup.2025-07-09_18.08.23.out
==> Experiment #2 (2/4):
==>     name: kripke.kripke.kripke_kripke_single_node_strong_scaling_caliper_time_mpi_2_2_2_64_64_32_64_1_128_128_4_8
==>     root experiment_index: 2
==>     log file: /home/jovyan/benchpark/wkp/kripke-benchmark/hpc-tutorial/workspace/logs/setup.2025-07-09_18.08.23/kripke.kripke.kripke_kripke_single_node_strong_scaling_caliper_time_mpi_2_2_2_64_64_32_64_1_128_128_4_8.out
==>   Returning to log file: /home/jovyan/benchpark/wkp/kripke-benchmark/hpc-tutorial/workspace/logs/setup.2025-07-09_18.08.23.out
==> Experiment #3 (3/4):
==>     name: kripke.kripke.kripke_kripke_single_node_strong_scaling_caliper_time_mpi_4_2_2_64_64_32_64_1_128_128_4_16
==>     root experiment_index: 3
==>     log file: /home/jovyan/benchpark/wkp/kripke-benchmark/hpc-tutorial/workspace/logs/setup.2025-07-09_18.08.23/kripke.kripke.kripke_kripke_single_node_strong_scaling_caliper_time_mpi_4_2_2_64_64_32_64_1_128_128_4_16.out
==>   Returning to log file: /home/jovyan/benchpark/wkp/kripke-benchmark/hpc-tutorial/workspace/logs/setup.2025-07-09_18.08.23.out
==> Experiment #4 (4/4):
==>     name: kripke.kripke.kripke_kripke_single_node_strong_scaling_caliper_time_mpi_4_4_2_64_64_32_64_1_128_128_4_32
==>     root experiment_index: 4
==>     log file: /home/jovyan/benchpark/wkp/kripke-benchmark/hpc-tutorial/workspace/logs/setup.2025-07-09_18.08.23/kripke.kripke.kripke_kripke_single_node_strong_scaling_caliper_time_mpi_4_4_2_64_64_32_64_1_128_128_4_32.out
==>   Returning to log file: /home/jovyan/benchpark/wkp/kripke-benchmark/hpc-tutorial/workspace/logs/setup.2025-07-09_18.08.23.out
Step 7: Run Kripke Experiment using Ramble
Next, run the Kripke strong scaling experiment by running the following command:
ramble \
--workspace-dir /home/jovyan/benchpark/wkp/kripke-benchmark/hpc-tutorial/workspace \
on
This command submits the batch scripts (e.g., submission scripts) generated in Step 6 to the system’s resource manager (which is specified
in the files generated by benchpark system init). For the AWS
infrastructure used in this tutorial, the resource manager is LLNL’s Flux resource manager.
If the above command is successful, you should see something like:
==> Streaming details to log:
==>   /home/jovyan/benchpark/wkp/kripke-benchmark/hpc-tutorial/workspace/logs/execute.2025-07-09_18.14.08.out
==>   Executing 4 out of 4 experiments:
==>   Log files for experiments are stored in: /home/jovyan/benchpark/wkp/kripke-benchmark/hpc-tutorial/workspace/logs/execute.2025-07-09_18.14.08
==> Running executors...
ƒV54uD5o5
ƒV57fKkEK
ƒV5ANUS6s
ƒV5D498h5
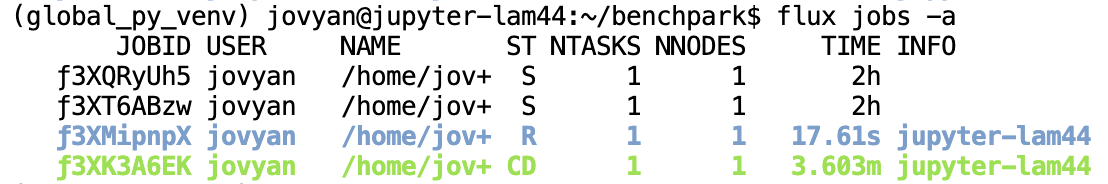
The final lines printed by the ramble on command are the job IDs produced by the system resource manager. You can use
these IDs to track the progress of the jobs in your experiment. For example, with Flux, you can see job status by running:
flux jobs -a
This command will produce an output like:
Note
If you are running on our AWS infrastructure, it should take roughly 1 minute for all jobs to finish running. Additionally, only one job will run at a time under our infrastructure because each user only has 1 node. If you are running on an HPC system, expect the jobs to complete faster.
After all the jobs are finished, each job directory (i.e., subdirectories of
/home/jovyan/benchpark/wkp/kripke-benchmark/hpc-tutorial/workspace/experiments/kripke/kripke)
will contain a Caliper output file (i.e., a .cali file) containing performance data for the job.
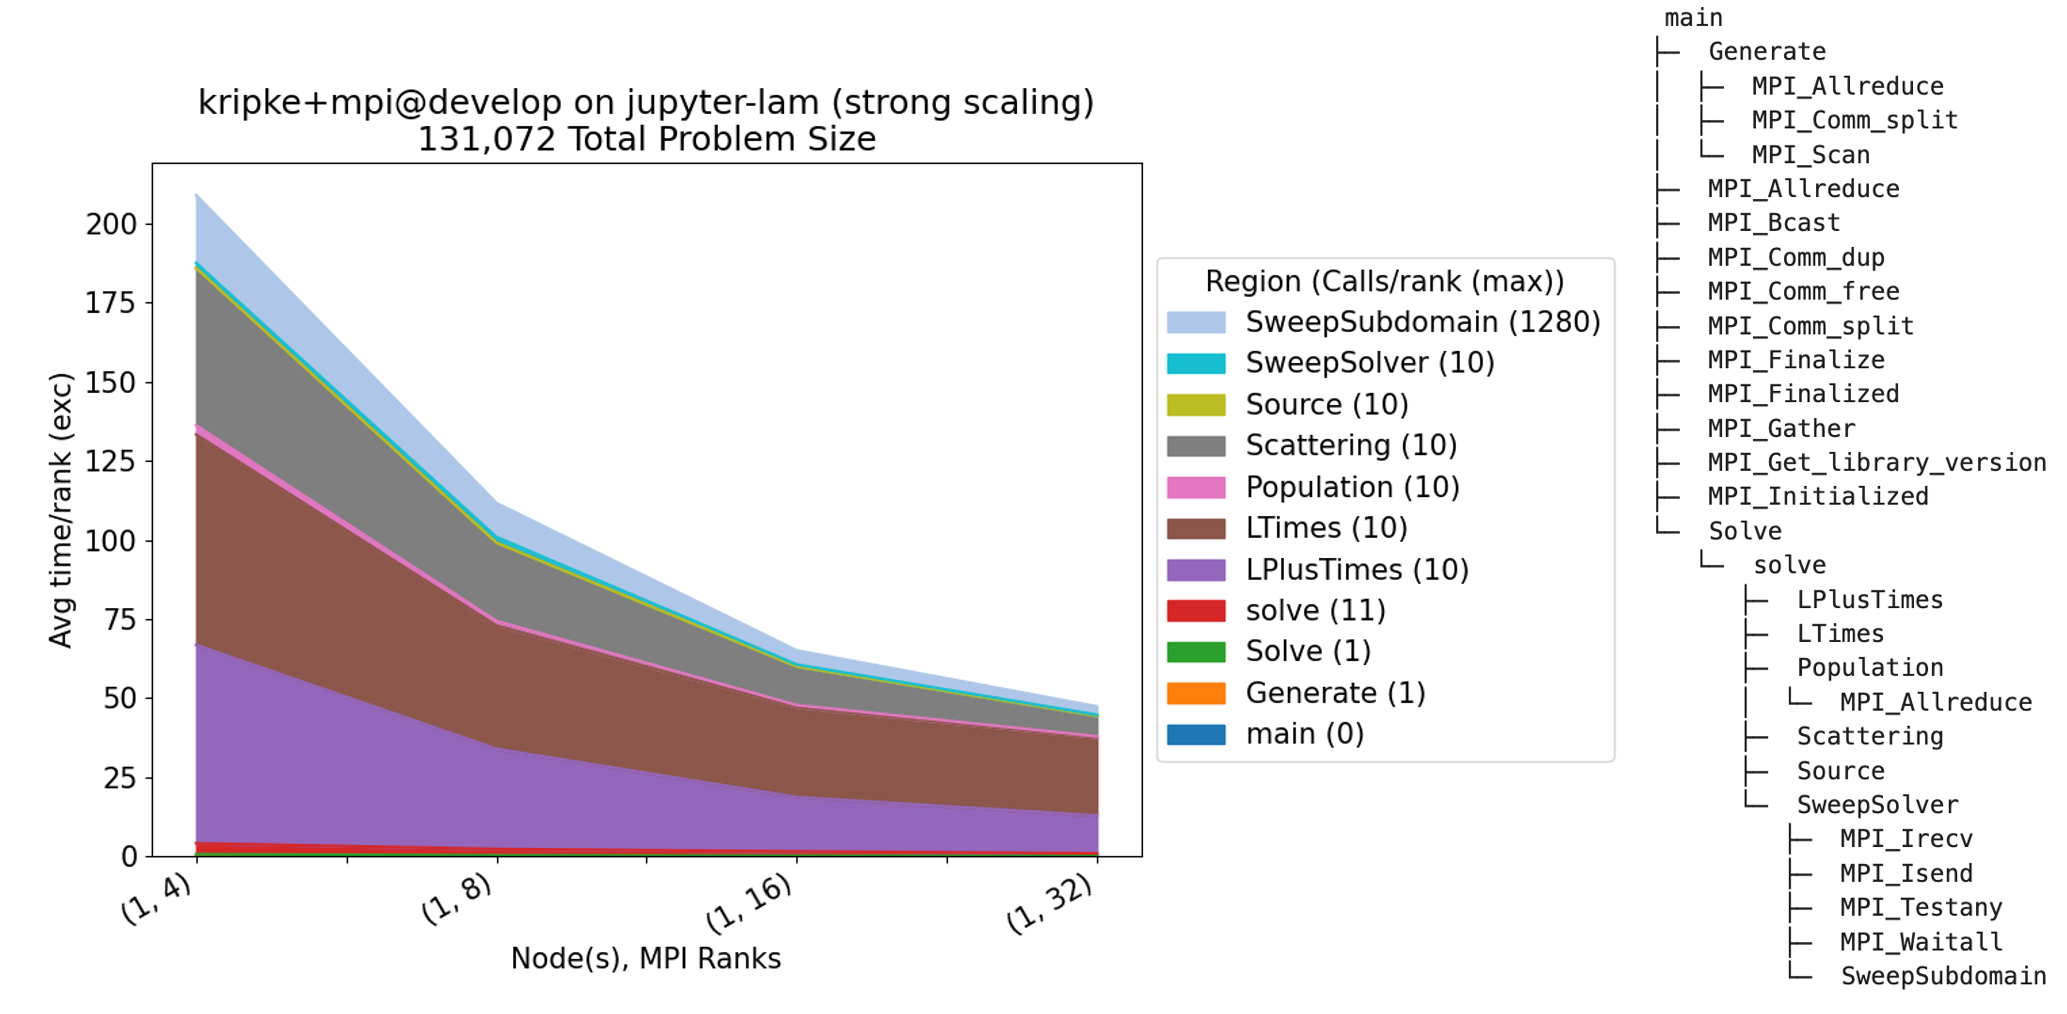
Step 8: Analyze Results
Finally, we perform pre-defined analysis on the Caliper files generated by the
scaling study we defined in the experiment. The benchpark analyze command uses
the Thicket performance analysis tool to
compose the Caliper performance profiles and visualize the scaling performance.
We focus on the application-level function calls, specifying the --no-mpi flag to hide MPI
function calls in the resulting graph. We also specify --chart-fontsize to
increase the overall font size in the resulting graph, helpful for better readability of
the graph in presentations.
benchpark analyze \
--workspace-dir /home/jovyan/benchpark/wkp/kripke-benchmark/hpc-tutorial/workspace \
--no-mpi \
--chart-fontsize 15
The command above reads in the Caliper files generated by the experiment and
outputs several files, such as the stacked area chart and Caliper calling context tree shown below.
These files can be found in /home/jovyan/benchpark/wkp/kripke-benchmark/hpc-tutorial/workspace/analyze.
Next Steps
Now that you know how to initialize, run, and analyze the performance of an experiment, check out our Benchpark Workflow page for more information on how to interact with Benchpark. We have guides for users wanting to add or modify a system, add a new benchmark, or define a new experiment parameters for a benchmark.