Quick Start Guide
This guide will help you get started with TreeScape quickly.
Introduction
TreeScape is a Jupyter-based visualization tool for performance data, enabling users to programmatically render graphs. With TreeScape, you can load an ensemble of Caliper performance files and visualize the collective performance of an application across many runs.
TreeScape is the replacement for SPOT, which was web-based. TreeScape is built on top of Jupyter notebooks, which are a way to create and share documents that contain live code, equations, visualizations and narrative text. TreeScape is designed to be used interactively in a Jupyter notebook. You can also use TreeScape in a Python script.
Basic Workflow
TreeScape follows a simple workflow:
Load Data: Use a Reader to load Caliper performance files
Create Model: Create a TreeScapeModel from the reader
Visualize: Use StackedLine or MultiLine to visualize the data
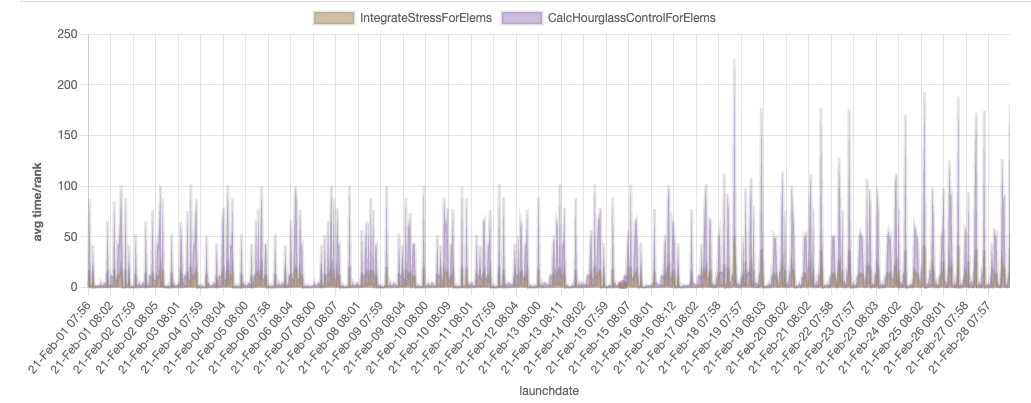
Example 1: Interactive Visualization
import treescape as ts

# Load all runs from a scaling study
cali_file_loc = "../datasets/newdemo/test"
reader = ts.CaliReader(cali_file_loc)
model = ts.TreeScapeModel(reader)

# Create visualization
viz = ts.StackedLine()
viz.setXAxis("launchdate")
viz.setYAxis("avg")
viz.setDrillLevel(["IntegrateStressForElems", "CalcHourglassControlForElems"])
viz.render(model)
Example 2: Multiple Caliper Files
You can load multiple Caliper files from different sources:
import treescape as ts

# Load from multiple directories or files
paths = [
    "/path/to/run1/",
    "/path/to/run2/",
    "/specific/file.cali"
]

reader = ts.CaliReader(paths)
model = ts.TreeScapeModel(reader)

viz = ts.StackedLine()
viz.setXAxis("problem_size")
viz.setDrillLevel(["main", "compute_loop"])
viz.render(model)
Example 3: Static Matplotlib Plot
For publication-quality plots, use MultiLine:
import treescape as ts

reader = ts.CaliReader("/path/to/cali/files")
model = ts.TreeScapeModel(reader)

# Filter and sort the data
sorted_model = sorted(model, key=lambda x: x.metadata["launchdate"])

# Create a multi-line plot
ml = ts.MultiLine(sorted_model)
ml.plot_sums(
    xaxis="launchdate",
    node_name="main",
    line_metadata_name="test"
)
Example 4: Using ThicketReader
TreeScape also supports the Thicket library:
import treescape as ts
import thicket as tt

# Load files using Thicket
profiles = ["/path/to/file1.cali", "/path/to/file2.cali"]
th_ens = tt.Thicket.from_caliperreader(profiles)

# Create ThicketReader
reader = ts.ThicketReader(th_ens, profiles, xaxis="launchdate")
model = ts.TreeScapeModel(reader)

# Visualize
viz = ts.StackedLine()
viz.render(model)
Customizing Visualizations
StackedLine offers many customization options:
viz = ts.StackedLine()

# Axis configuration
viz.setXAxis("problem_size")
viz.setYAxis("max")  # Options: "sum", "avg", "max", "min"

# Aggregation method
viz.setXAggregation("topmax")  # Options: "sum", "avg", "max", "min", "topmax"

# Y-axis limits
viz.setYMin(0.0)
viz.setYMax(100.0)

# Chart dimensions
viz.setWidth(1200)
viz.setHeight(600)

# Select components to show
viz.setComponents([ts.StackedLine.LINEGRAPHS, ts.StackedLine.FLAMEGRAPHS])

# Drill into specific functions
viz.setDrillLevel(["main", "compute_loop", "io_operations"])

viz.render(model)
Working with the Data Model
The TreeScapeModel is iterable and can be manipulated:
import treescape as ts

reader = ts.CaliReader("/path/to/cali/files")
model = ts.TreeScapeModel(reader)

# Iterate over runs
for run in model:
    print(f"Metadata: {run.metadata}")
    print(f"Performance tree: {run.perftree}")

# Filter runs
filtered = [run for run in model if run.metadata["problem_size"] > 100]

# Sort runs
sorted_runs = sorted(model, key=lambda x: x.metadata["launchdate"])

# Create a new model with filtered/sorted data
new_model = ts.TreeScapeModel(reader, sorted_runs)
Next Steps
Read the Core Concepts page to understand TreeScape’s architecture
Explore the Examples for more advanced use cases
Check the Readers API for detailed API documentation