2.3.2. CCL Tests
Note
Build instructions and execution commands are under development.
See Performance projections for the required projection coverage and reporting details.
2.3.2.1. Purpose
These benchmarks measure the worst-case latency of collective communication operations.
2.3.2.2. Characteristics
The tests cover accelerator-to-accelerator communication using RCCL Tests or an equivalent collective communication test suite. Equivalent suites must provide the same operation, data-type, message-size, and communicator coverage.
2.3.2.2.1. Problem
Run the following collective operations for each listed data type and message size:
Operation |
Data types |
Message sizes |
|---|---|---|
|
|
32 MiB, 1 GiB, 32 GiB, Optimal |
|
|
4 KiB, 32 MiB, 1 GiB, Optimal |
|
|
32 MiB, 1 GiB, 32 GiB, Optimal |
|
|
32 MiB, 1 GiB, 32 GiB, Optimal |
Use 4 KiB only for all-reduce; omit it for all-gather, all-to-all, and reduce-scatter because of the number of ranks at the tested scale.
The 32 GiB (32G) cases provide additional large-message coverage for
all-gather, all-to-all, and reduce-scatter. The supplied all-reduce results
cover 4 KiB, 32 MiB, and 1 GiB.
For the Optimal case, you may use the minimum message size that achieves
optimal bandwidth or protocol efficiency. Report the selected size. The
supplied 32 GiB results do not establish that size as optimal.
2.3.2.3. Source code modifications
Please see Run Rules Synopsis for general guidance on allowed modifications.
2.3.2.4. Building
The baseline results used RCCL Tests
at commit 60804faca583a141a94bc10d464cc3f3b6c71728 of the rocm-systems repository.
The baseline results used cce/20.0.0, cray-mpich/9.0.1, and rocm/6.4.3.
2.3.2.5. Running
Run every listed collective with and without partitioned communicators. Each run must use one Scalable Unit (SU). On El Capitan, one SU is 384 nodes. Report worst-case (maximum) latency for each operation, data type, message size, and communicator configuration.
The RCCL results below use NCCL_TESTS_SPLIT_MASK=0x0 for the unpartitioned
communicator and NCCL_TESTS_SPLIT_MASK=0x1 for partitioned communicators.
See Communicator masks for the rank grouping used in these runs.
2.3.2.6. Scaling on El Capitan
The following tables and charts show results for one SU (384 nodes) on
El Capitan. They compare in-place runtimes for the single group (0x0)
and even-odd split (0x1) configurations across message sizes and data types.
2.3.2.6.1. Measurement configuration
The following settings apply to the reported measurements across all collectives, data types, and masks.
Setting |
Value |
|---|---|
Buffer mode |
In-place |
Timed iterations |
|
Reported runtime |
Maximum time, |
Size step factor |
|
Warmup iterations depend on message size:
Message size |
|
|---|---|
4 KiB ( |
100 |
32 MiB ( |
50 |
At least 1 GiB ( |
3 |
Warmup counts for other sizes are unspecified. The step factor describes the benchmark configuration; the plots use only the supplied measurements. GPU counts and hardware details are unspecified in the source metadata.
2.3.2.6.1.1. Units and plot layout
Message-size suffixes K, M, and G denote binary byte sizes. Source
timings are in microseconds; the tables and charts show seconds, calculated as
seconds = microseconds / 1000000.
2.3.2.6.1.2. Communicator masks
The mask is the value of NCCL_TESTS_SPLIT_MASK:
Single group (
0x0): all CCL ranks belong to one group.Even-odd split (
0x1): even and odd CCL ranks form two groups that execute concurrently.
GPU membership depends on the CCL-rank-to-GPU mapping. These masks represent different communicator configurations.
2.3.2.6.2. All-reduce
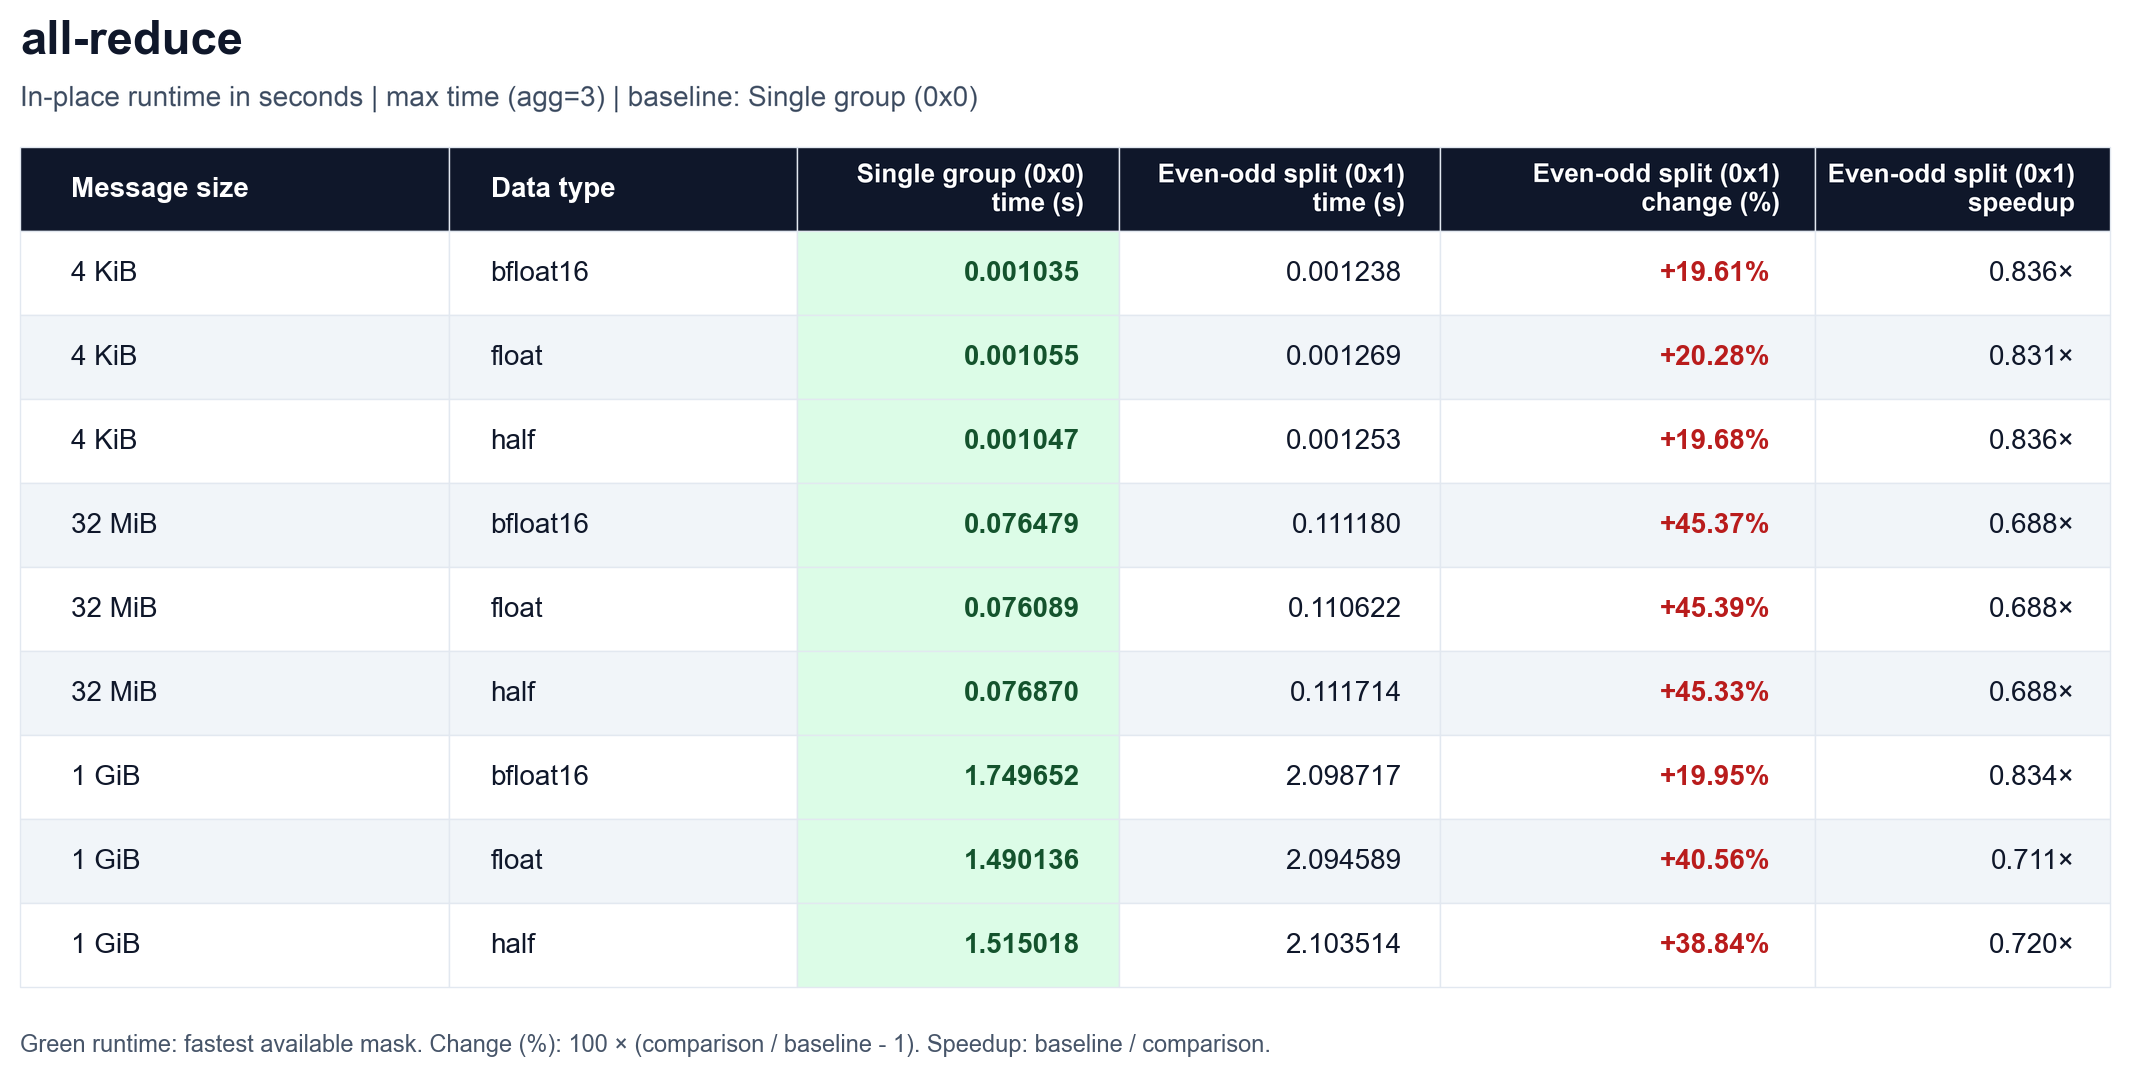
Fig. 2.10 All-reduce runtime comparison by message size and data type for single
group (0x0) and even-odd split (0x1).
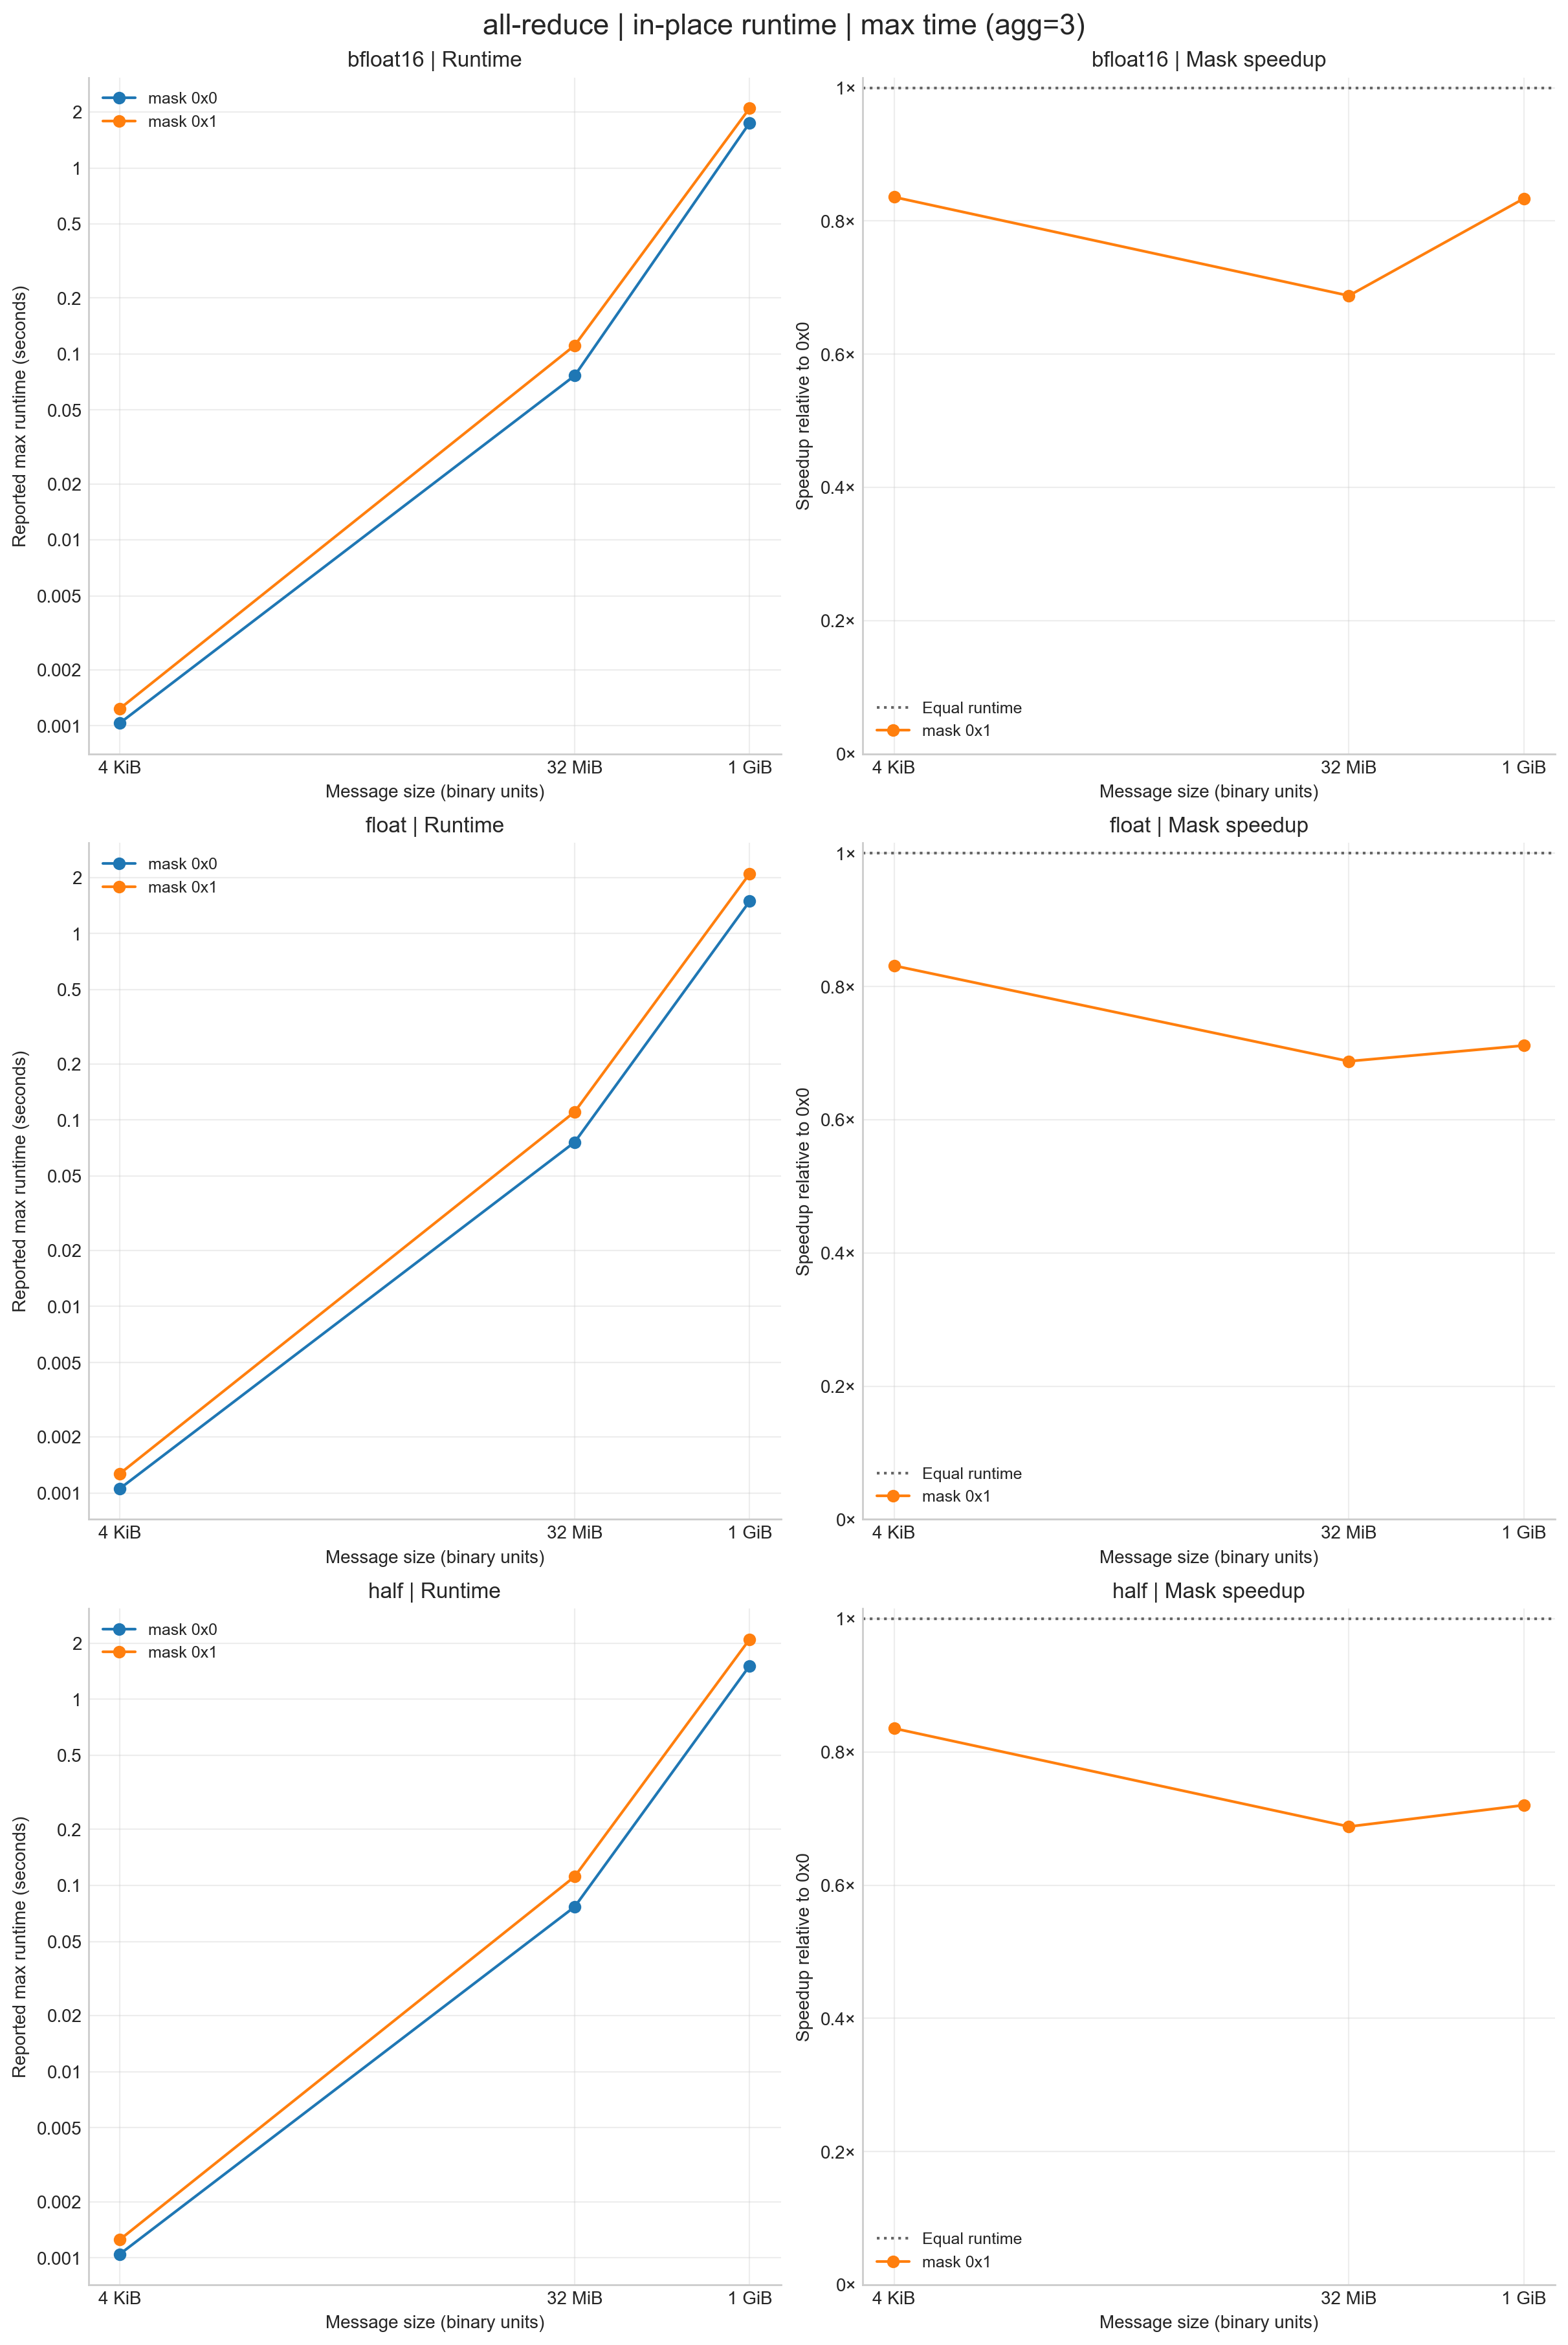
Fig. 2.11 All-reduce runtime and speedup relative to single group (0x0).
2.3.2.6.3. All-gather
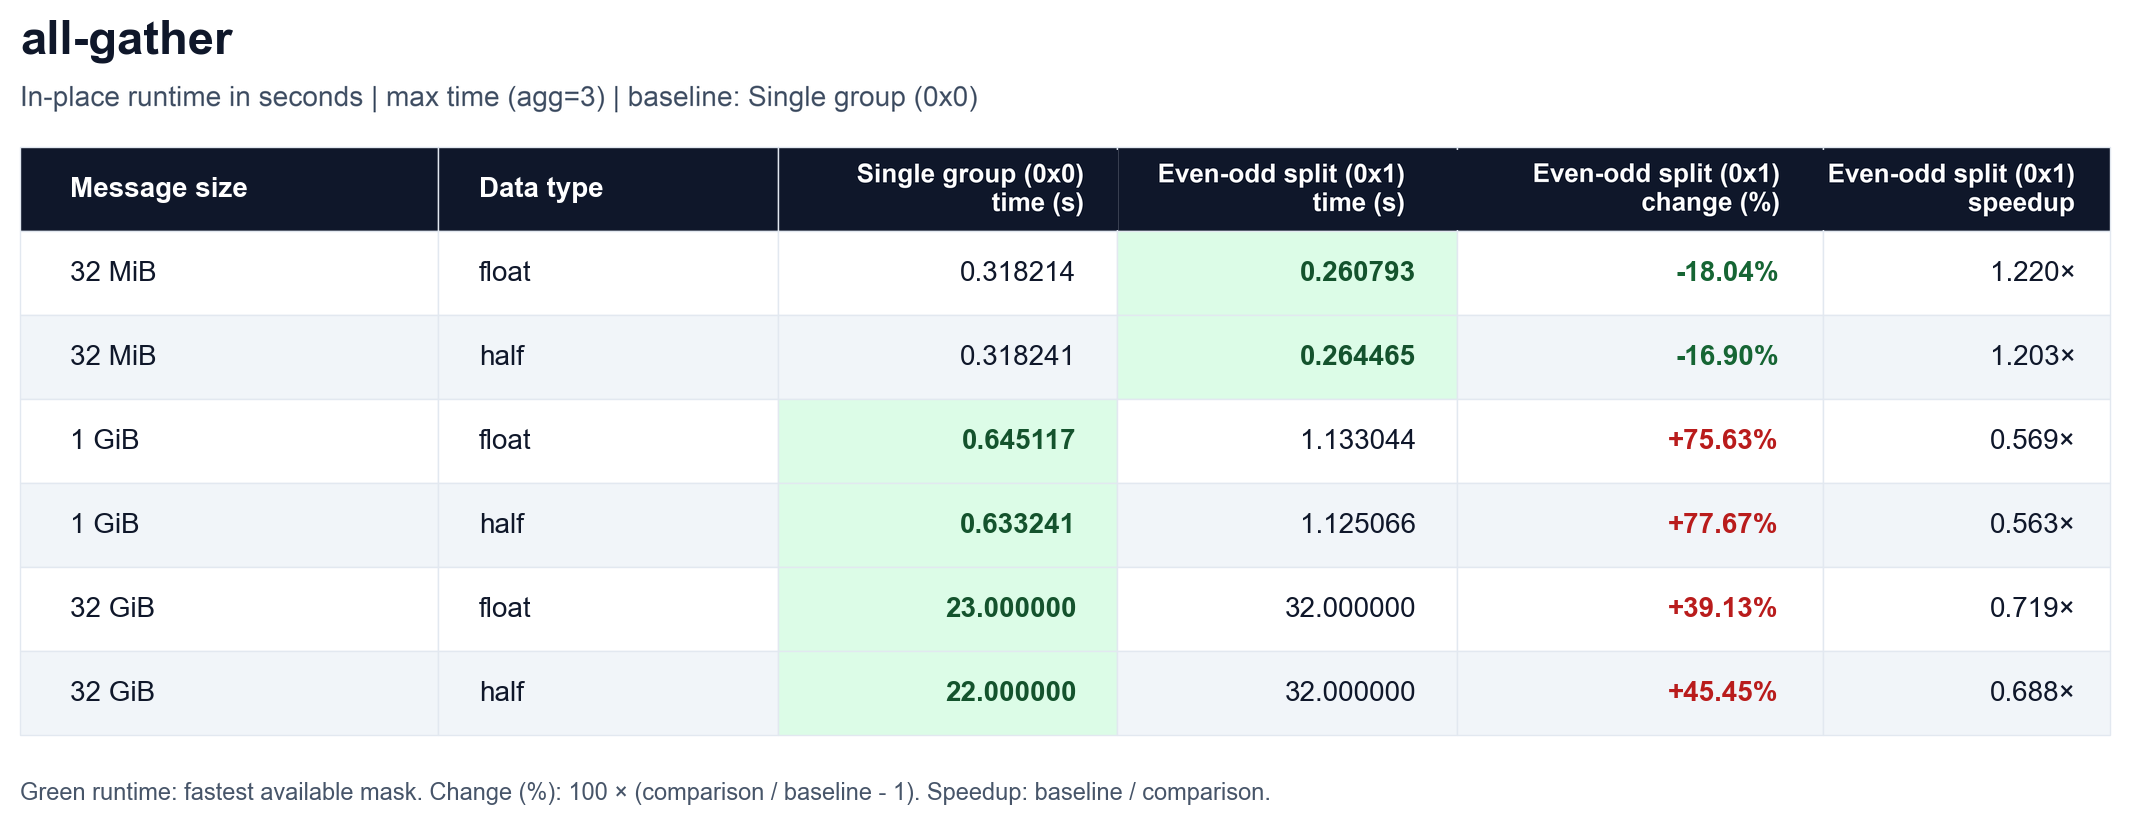
Fig. 2.12 All-gather runtime comparison by message size and data type for single
group (0x0) and even-odd split (0x1).
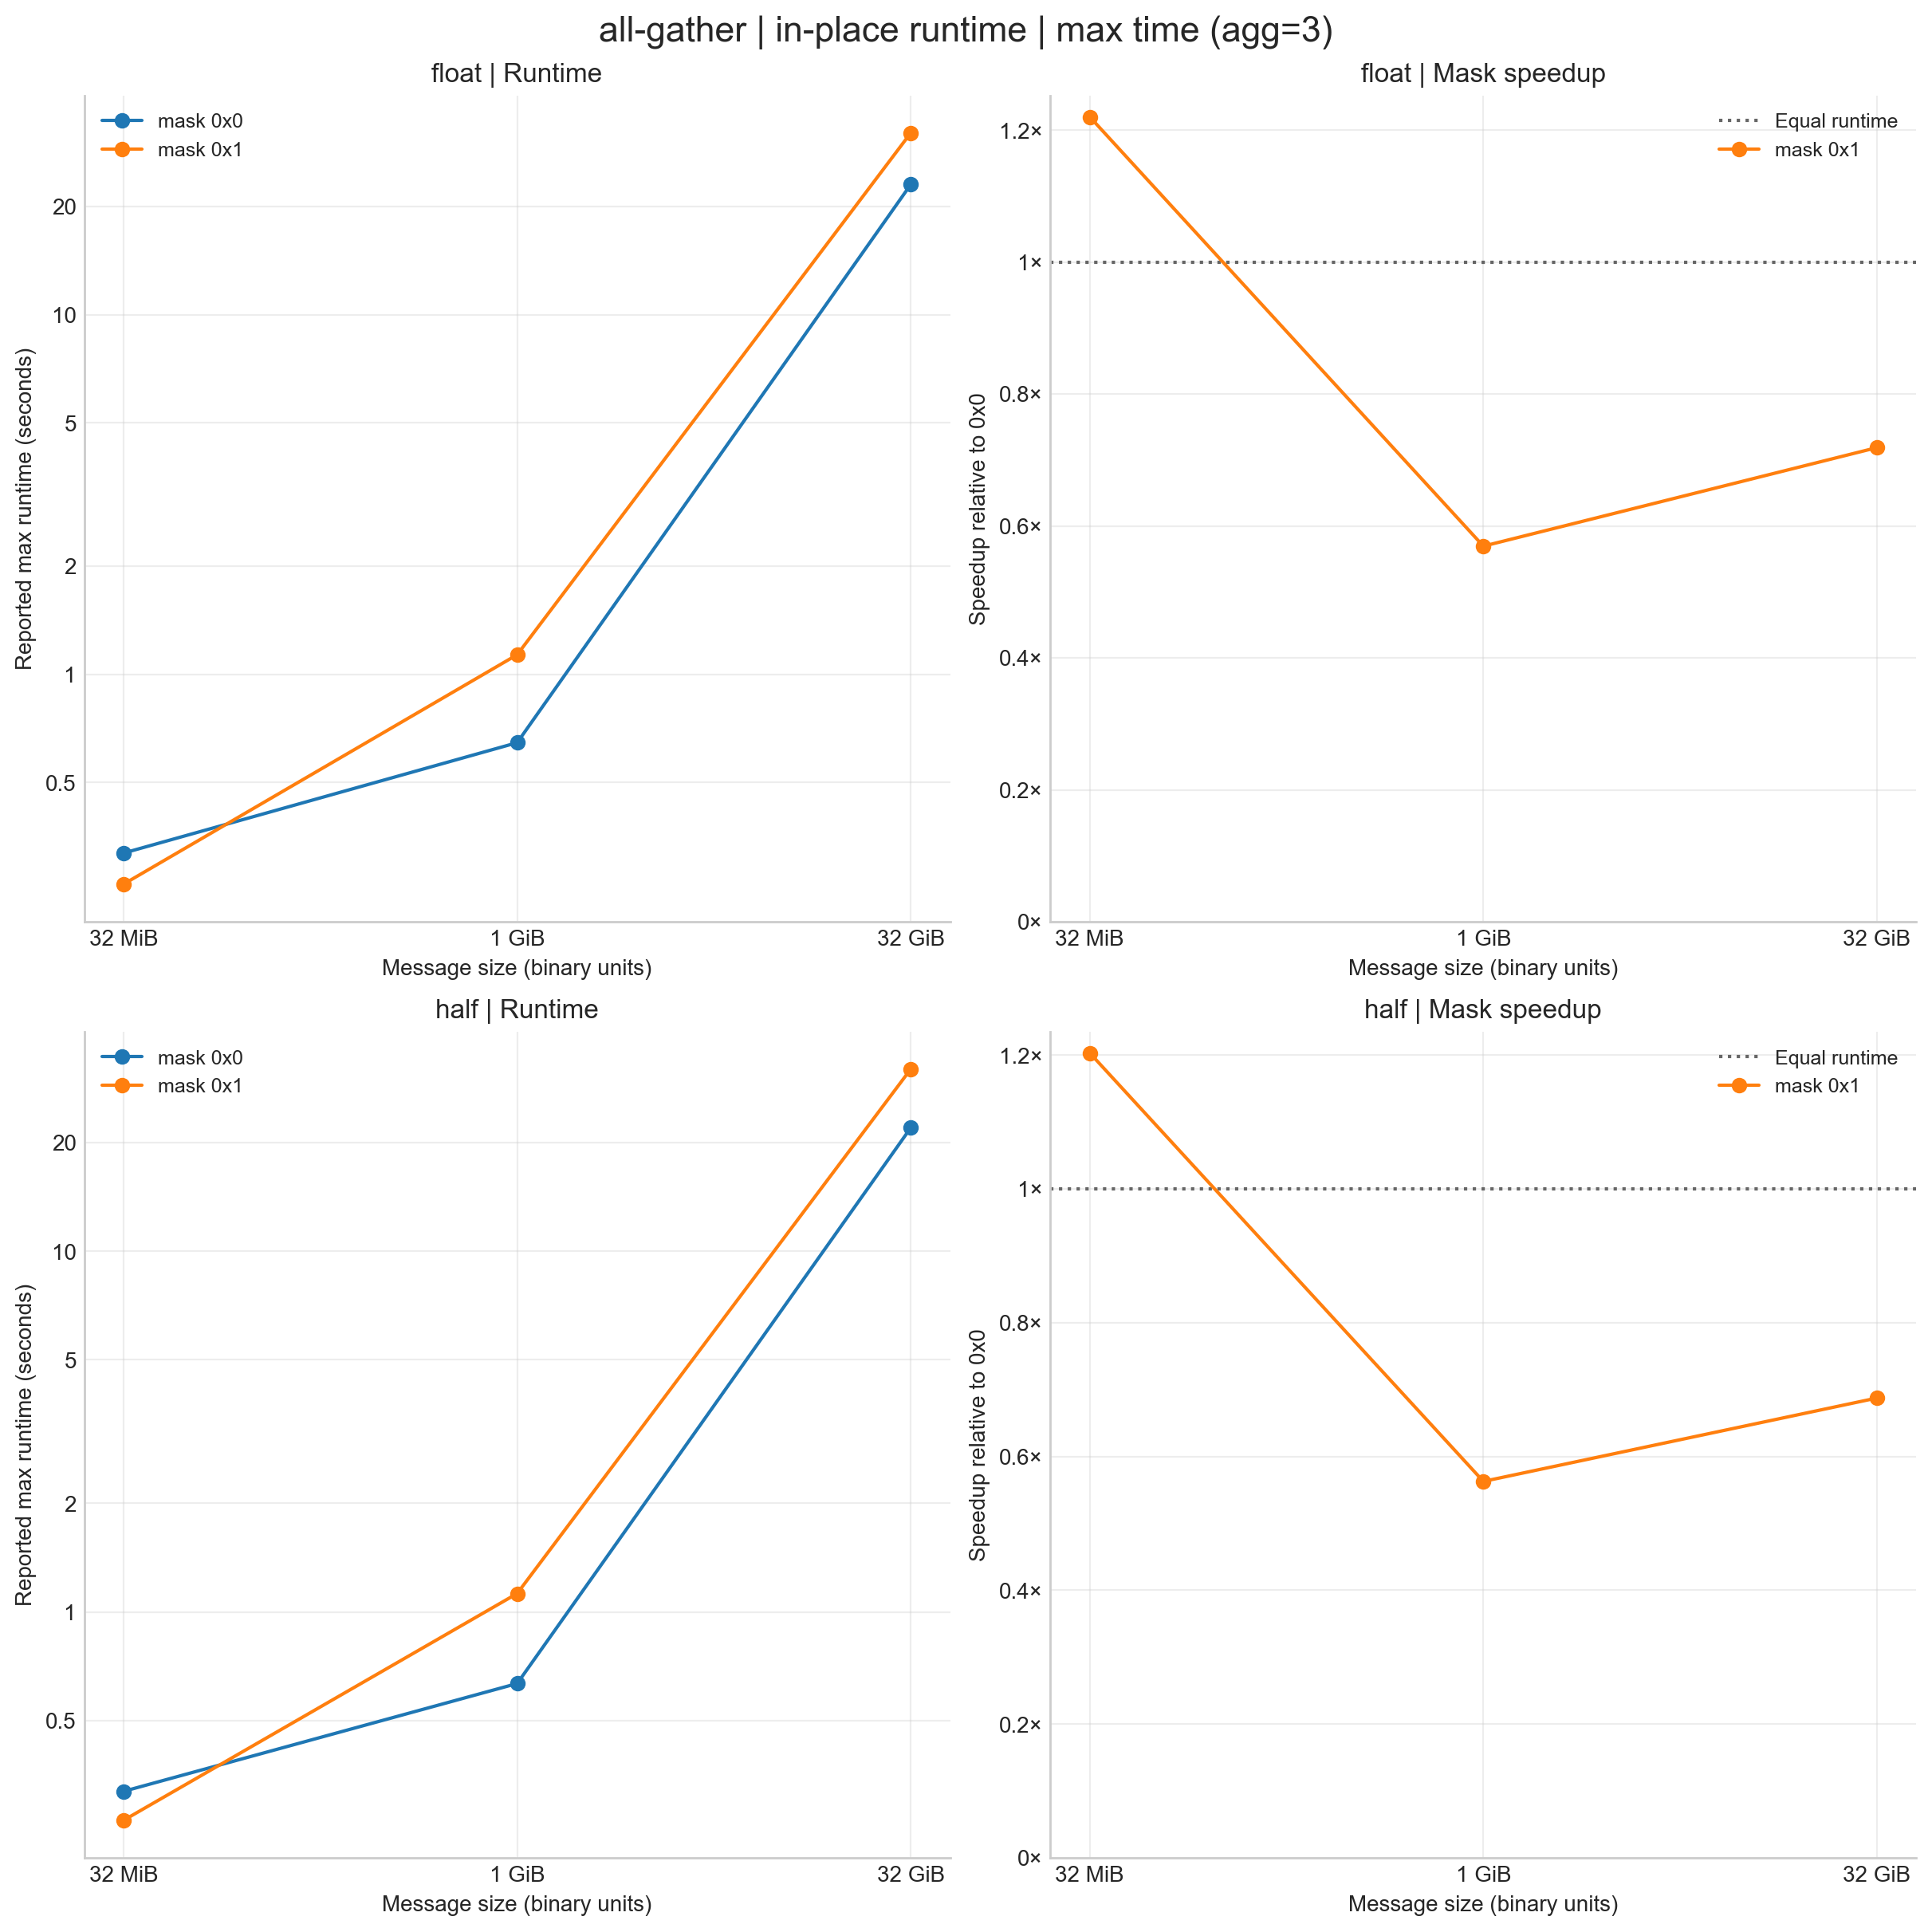
Fig. 2.13 All-gather runtime and speedup relative to single group (0x0).
2.3.2.6.4. Reduce-scatter
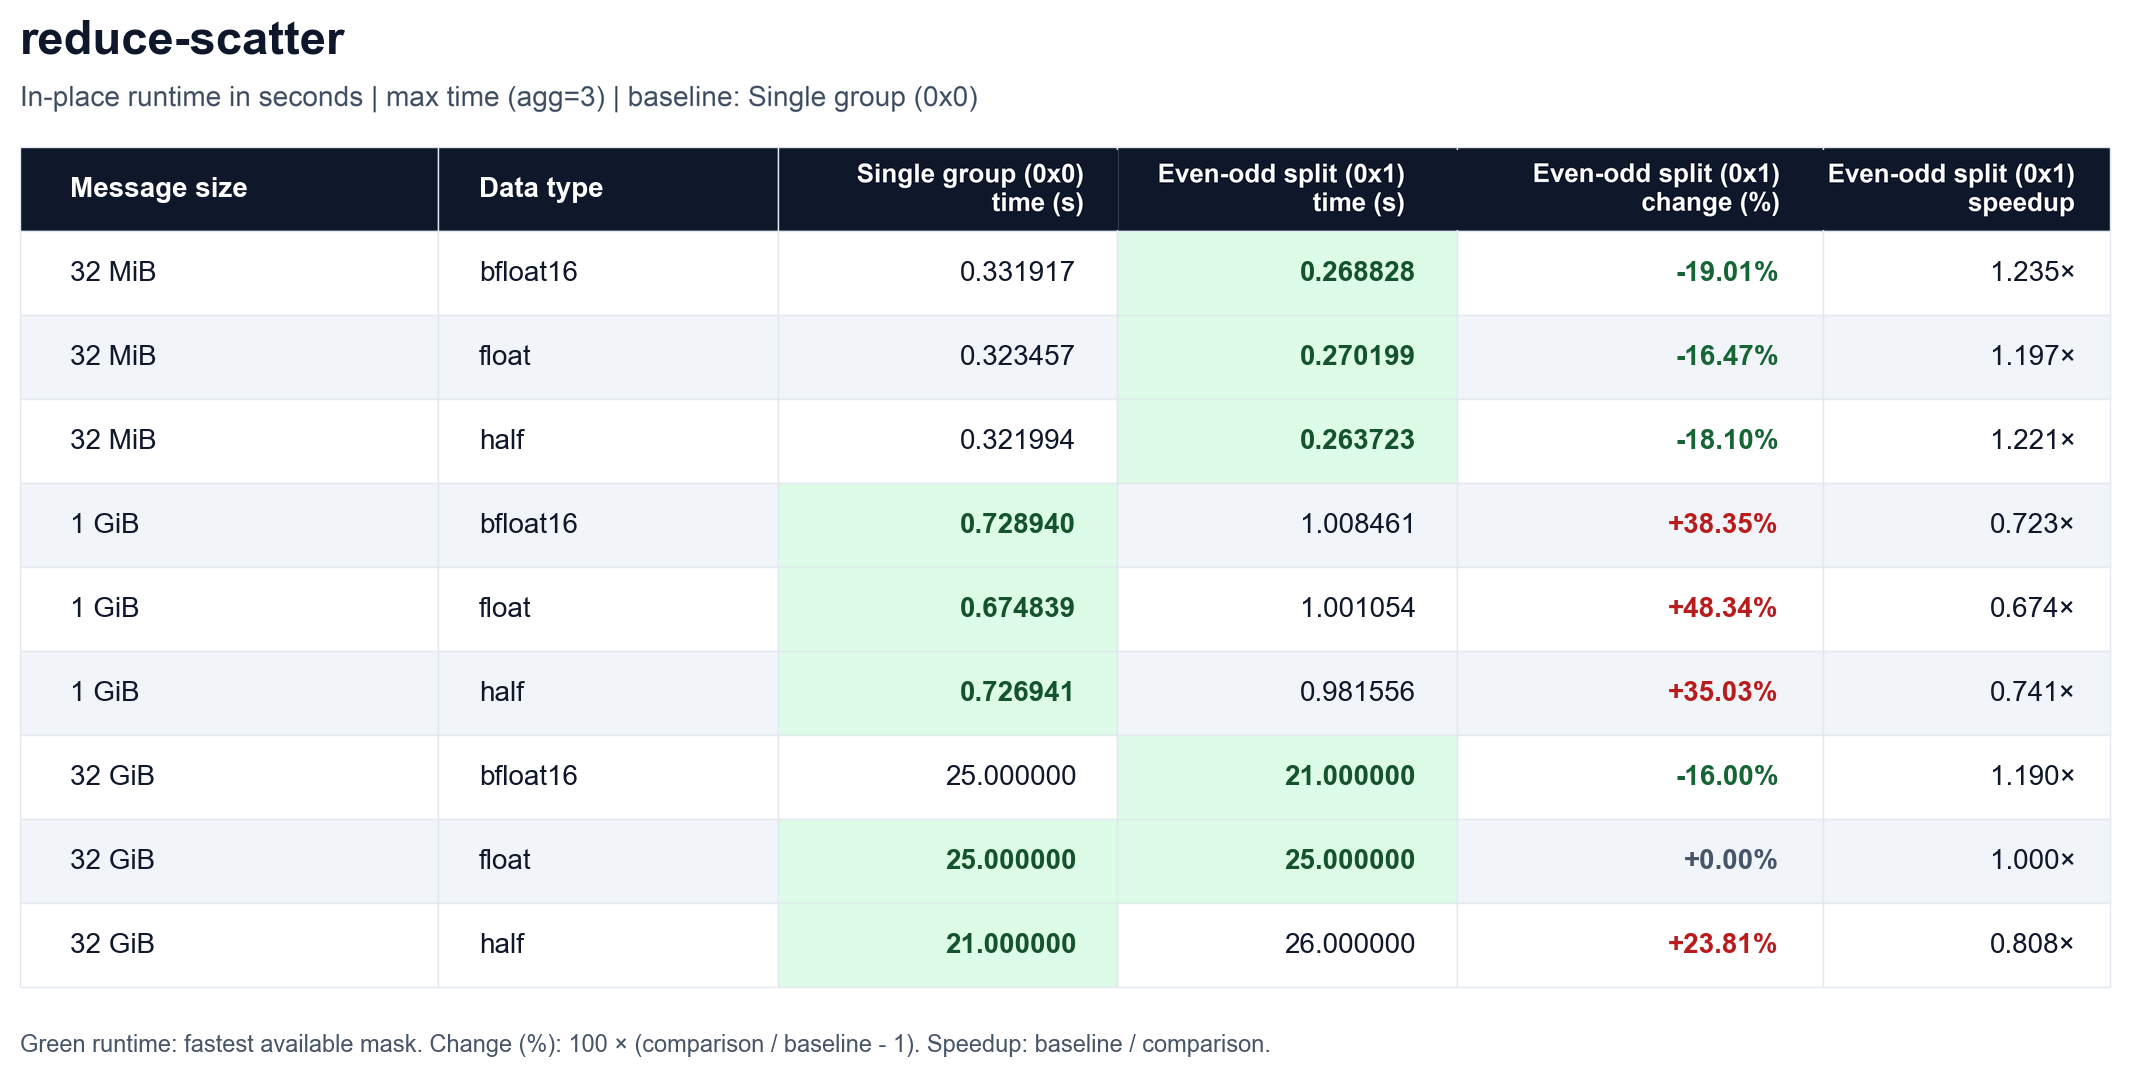
Fig. 2.14 Reduce-scatter runtime comparison by message size and data type for single
group (0x0) and even-odd split (0x1).
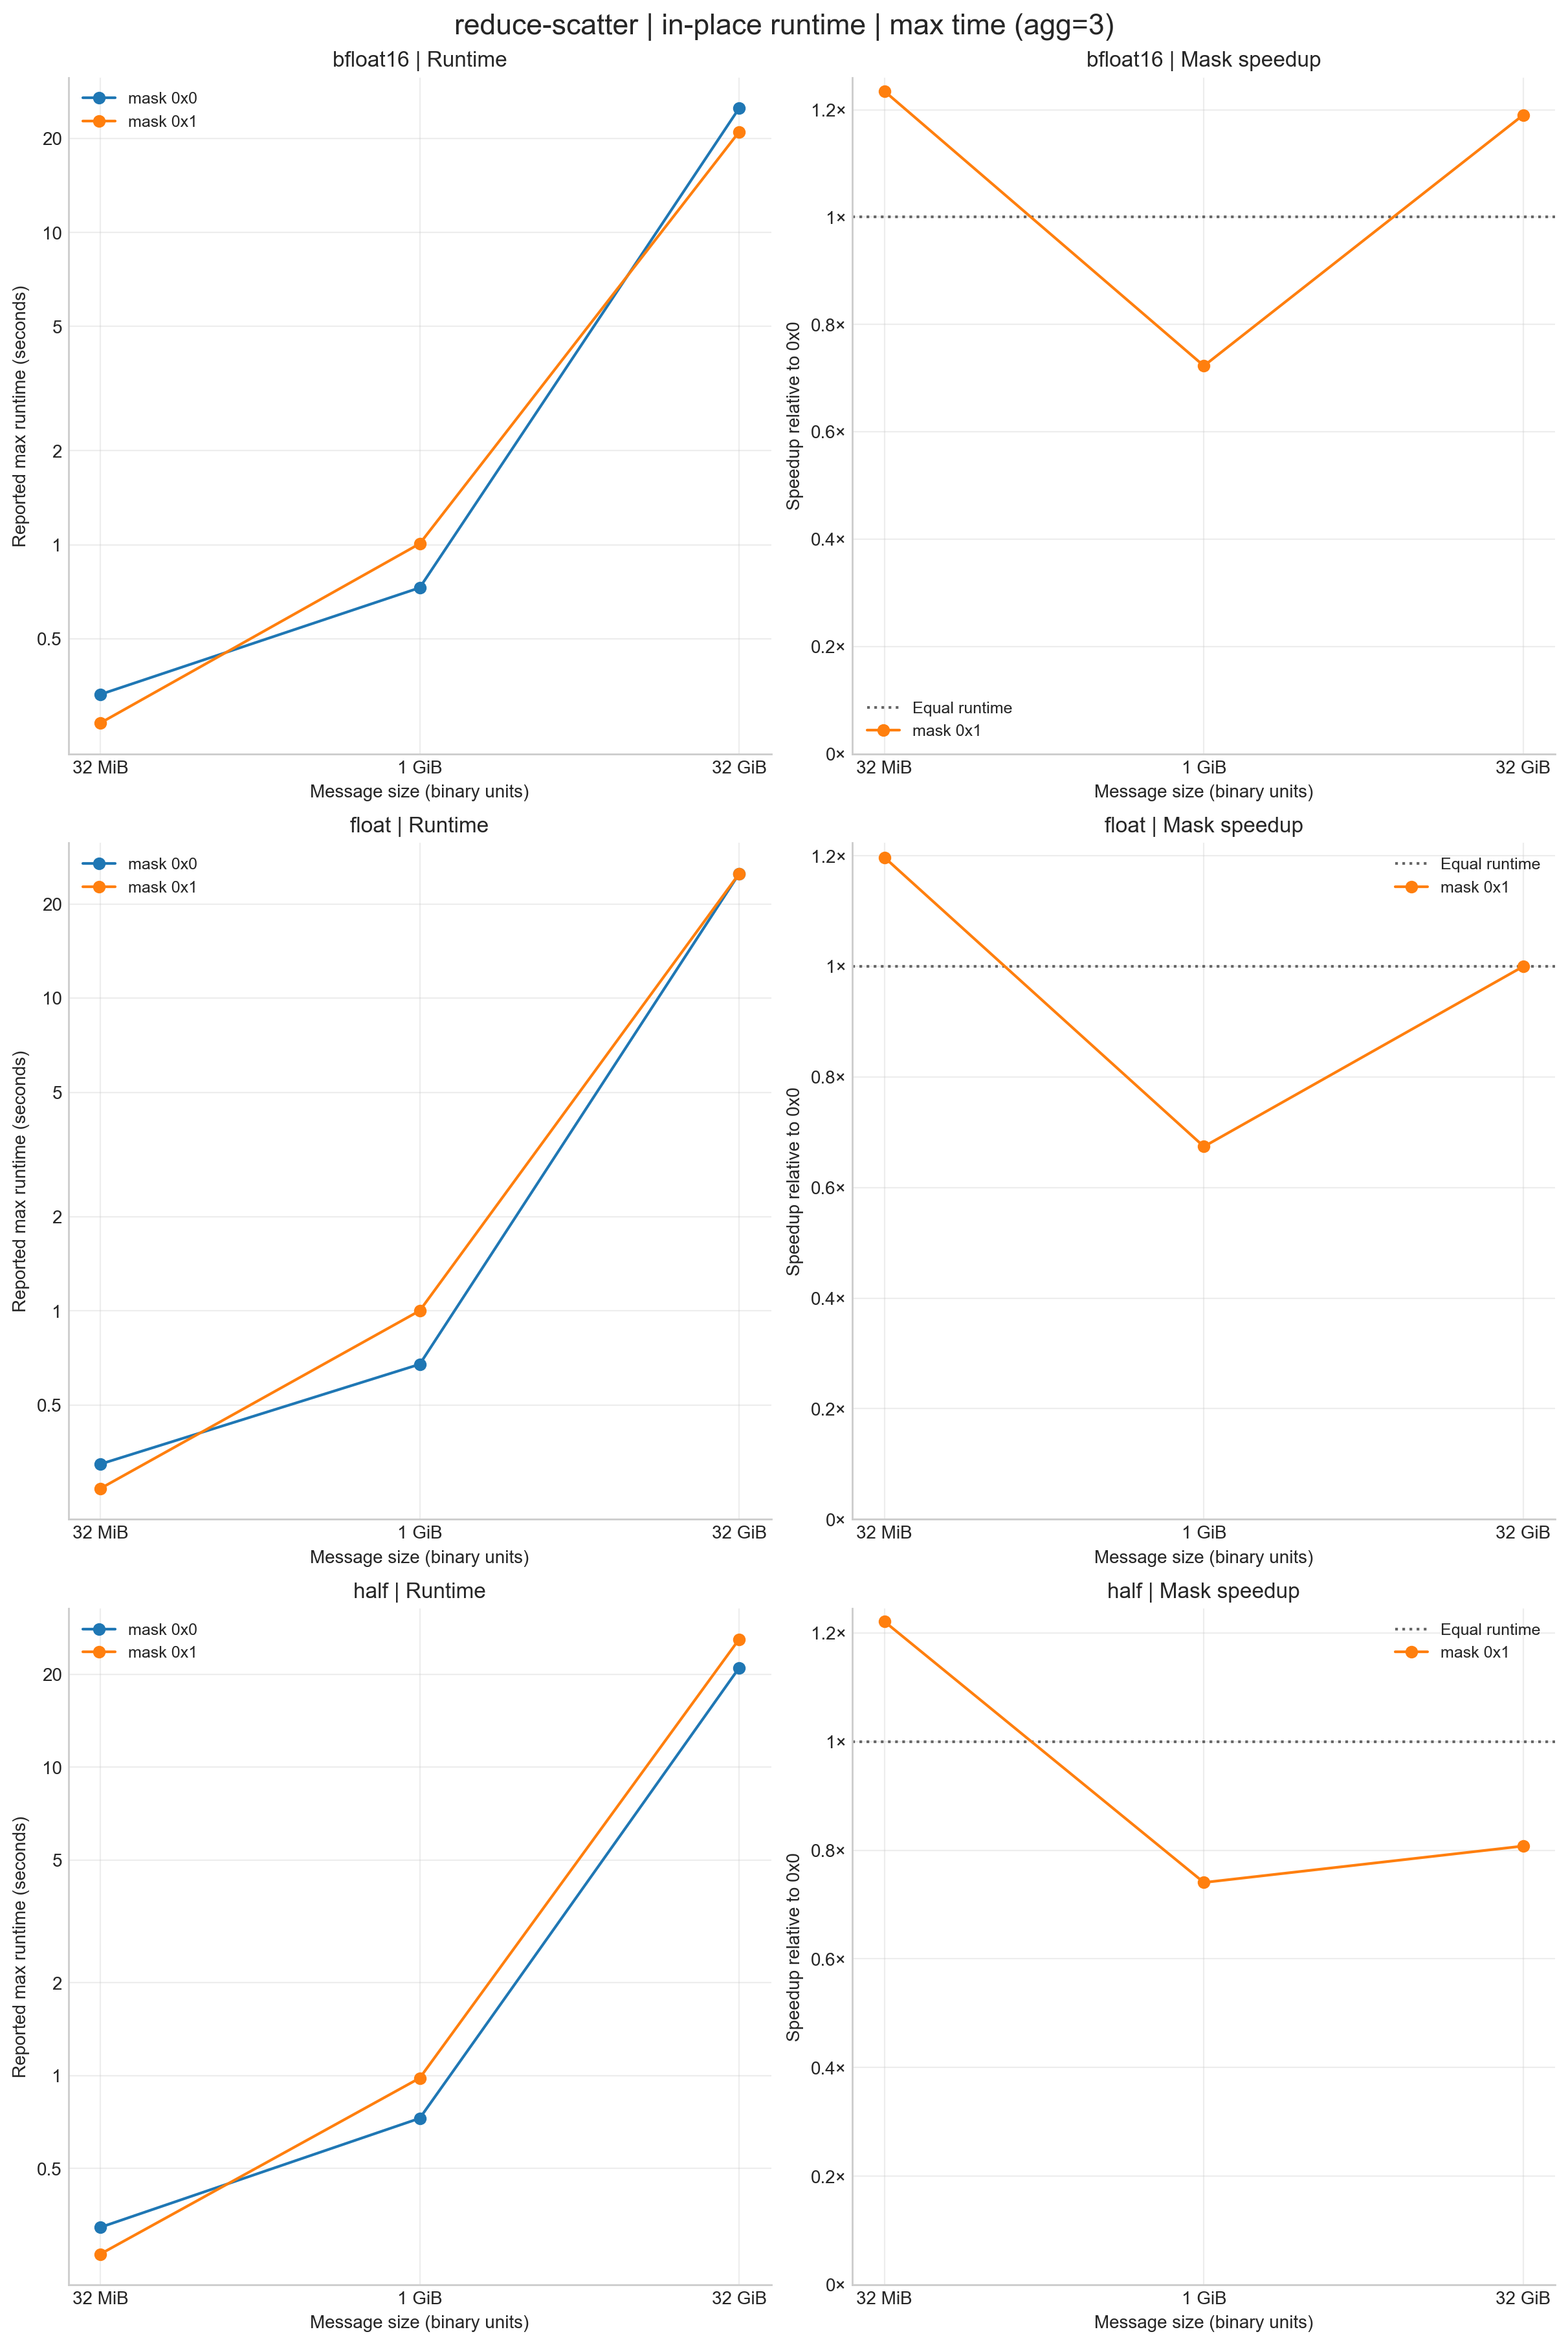
Fig. 2.15 Reduce-scatter runtime and speedup relative to single group (0x0).
2.3.2.6.5. All-to-all
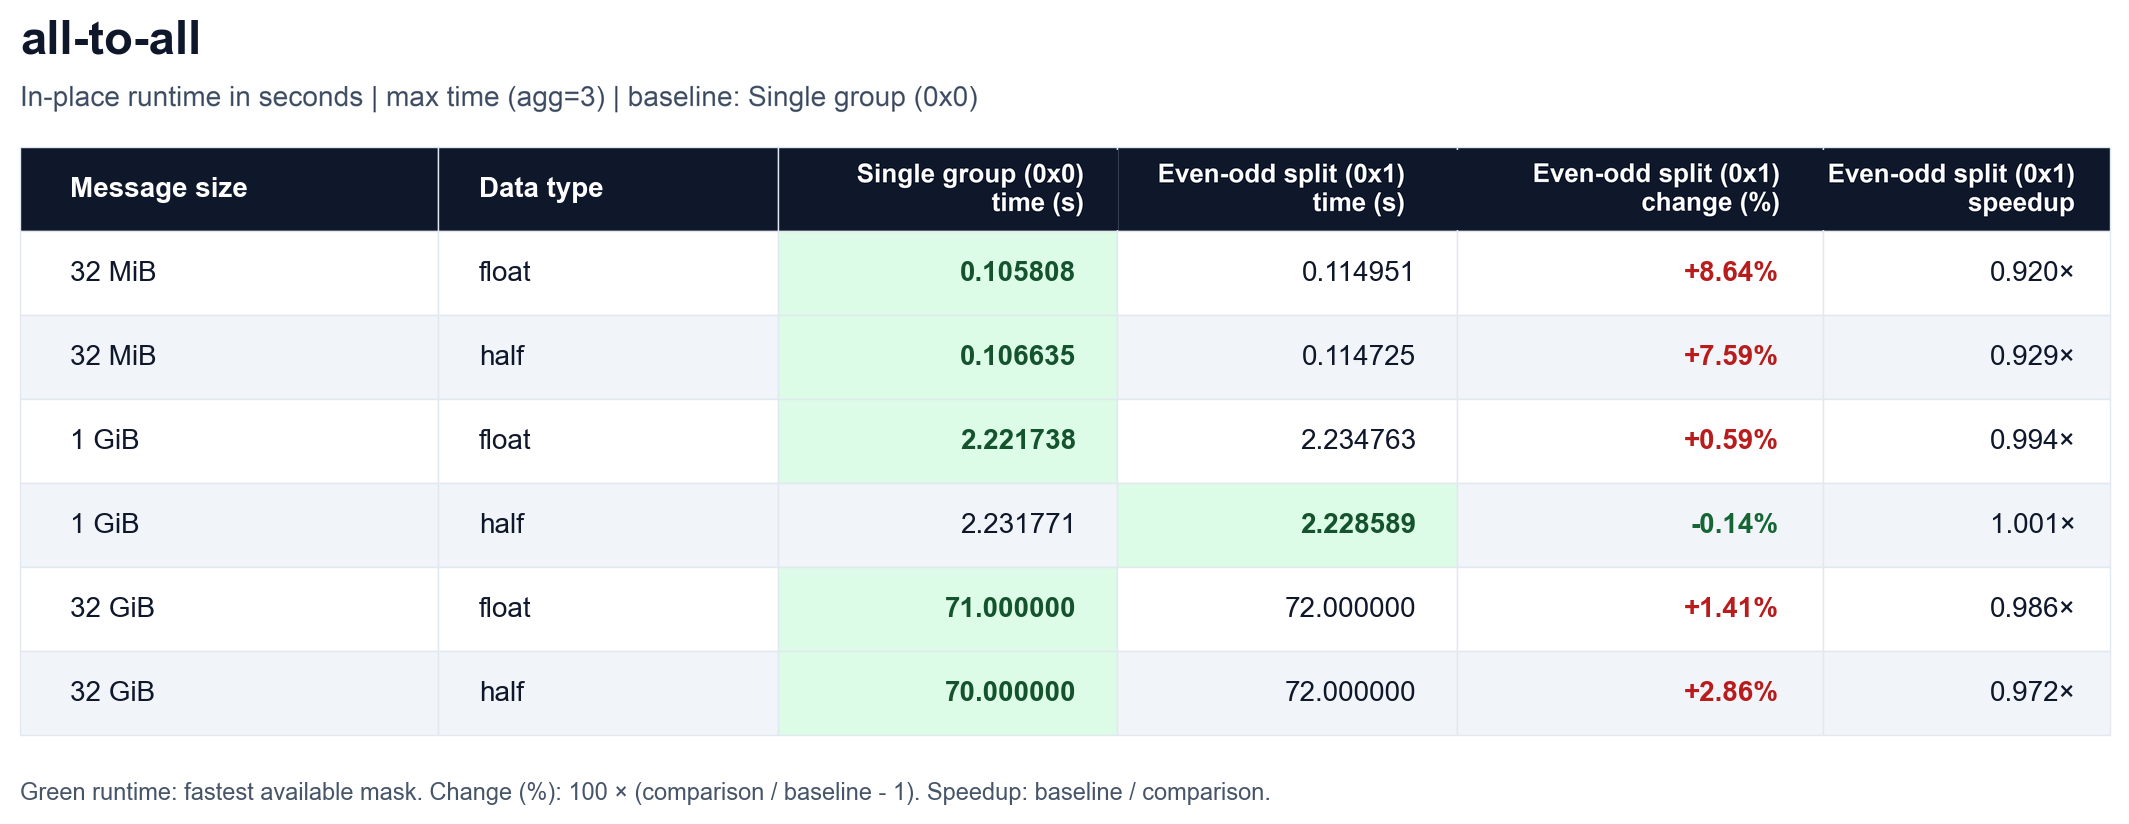
Fig. 2.16 All-to-all runtime comparison by message size and data type for single
group (0x0) and even-odd split (0x1).
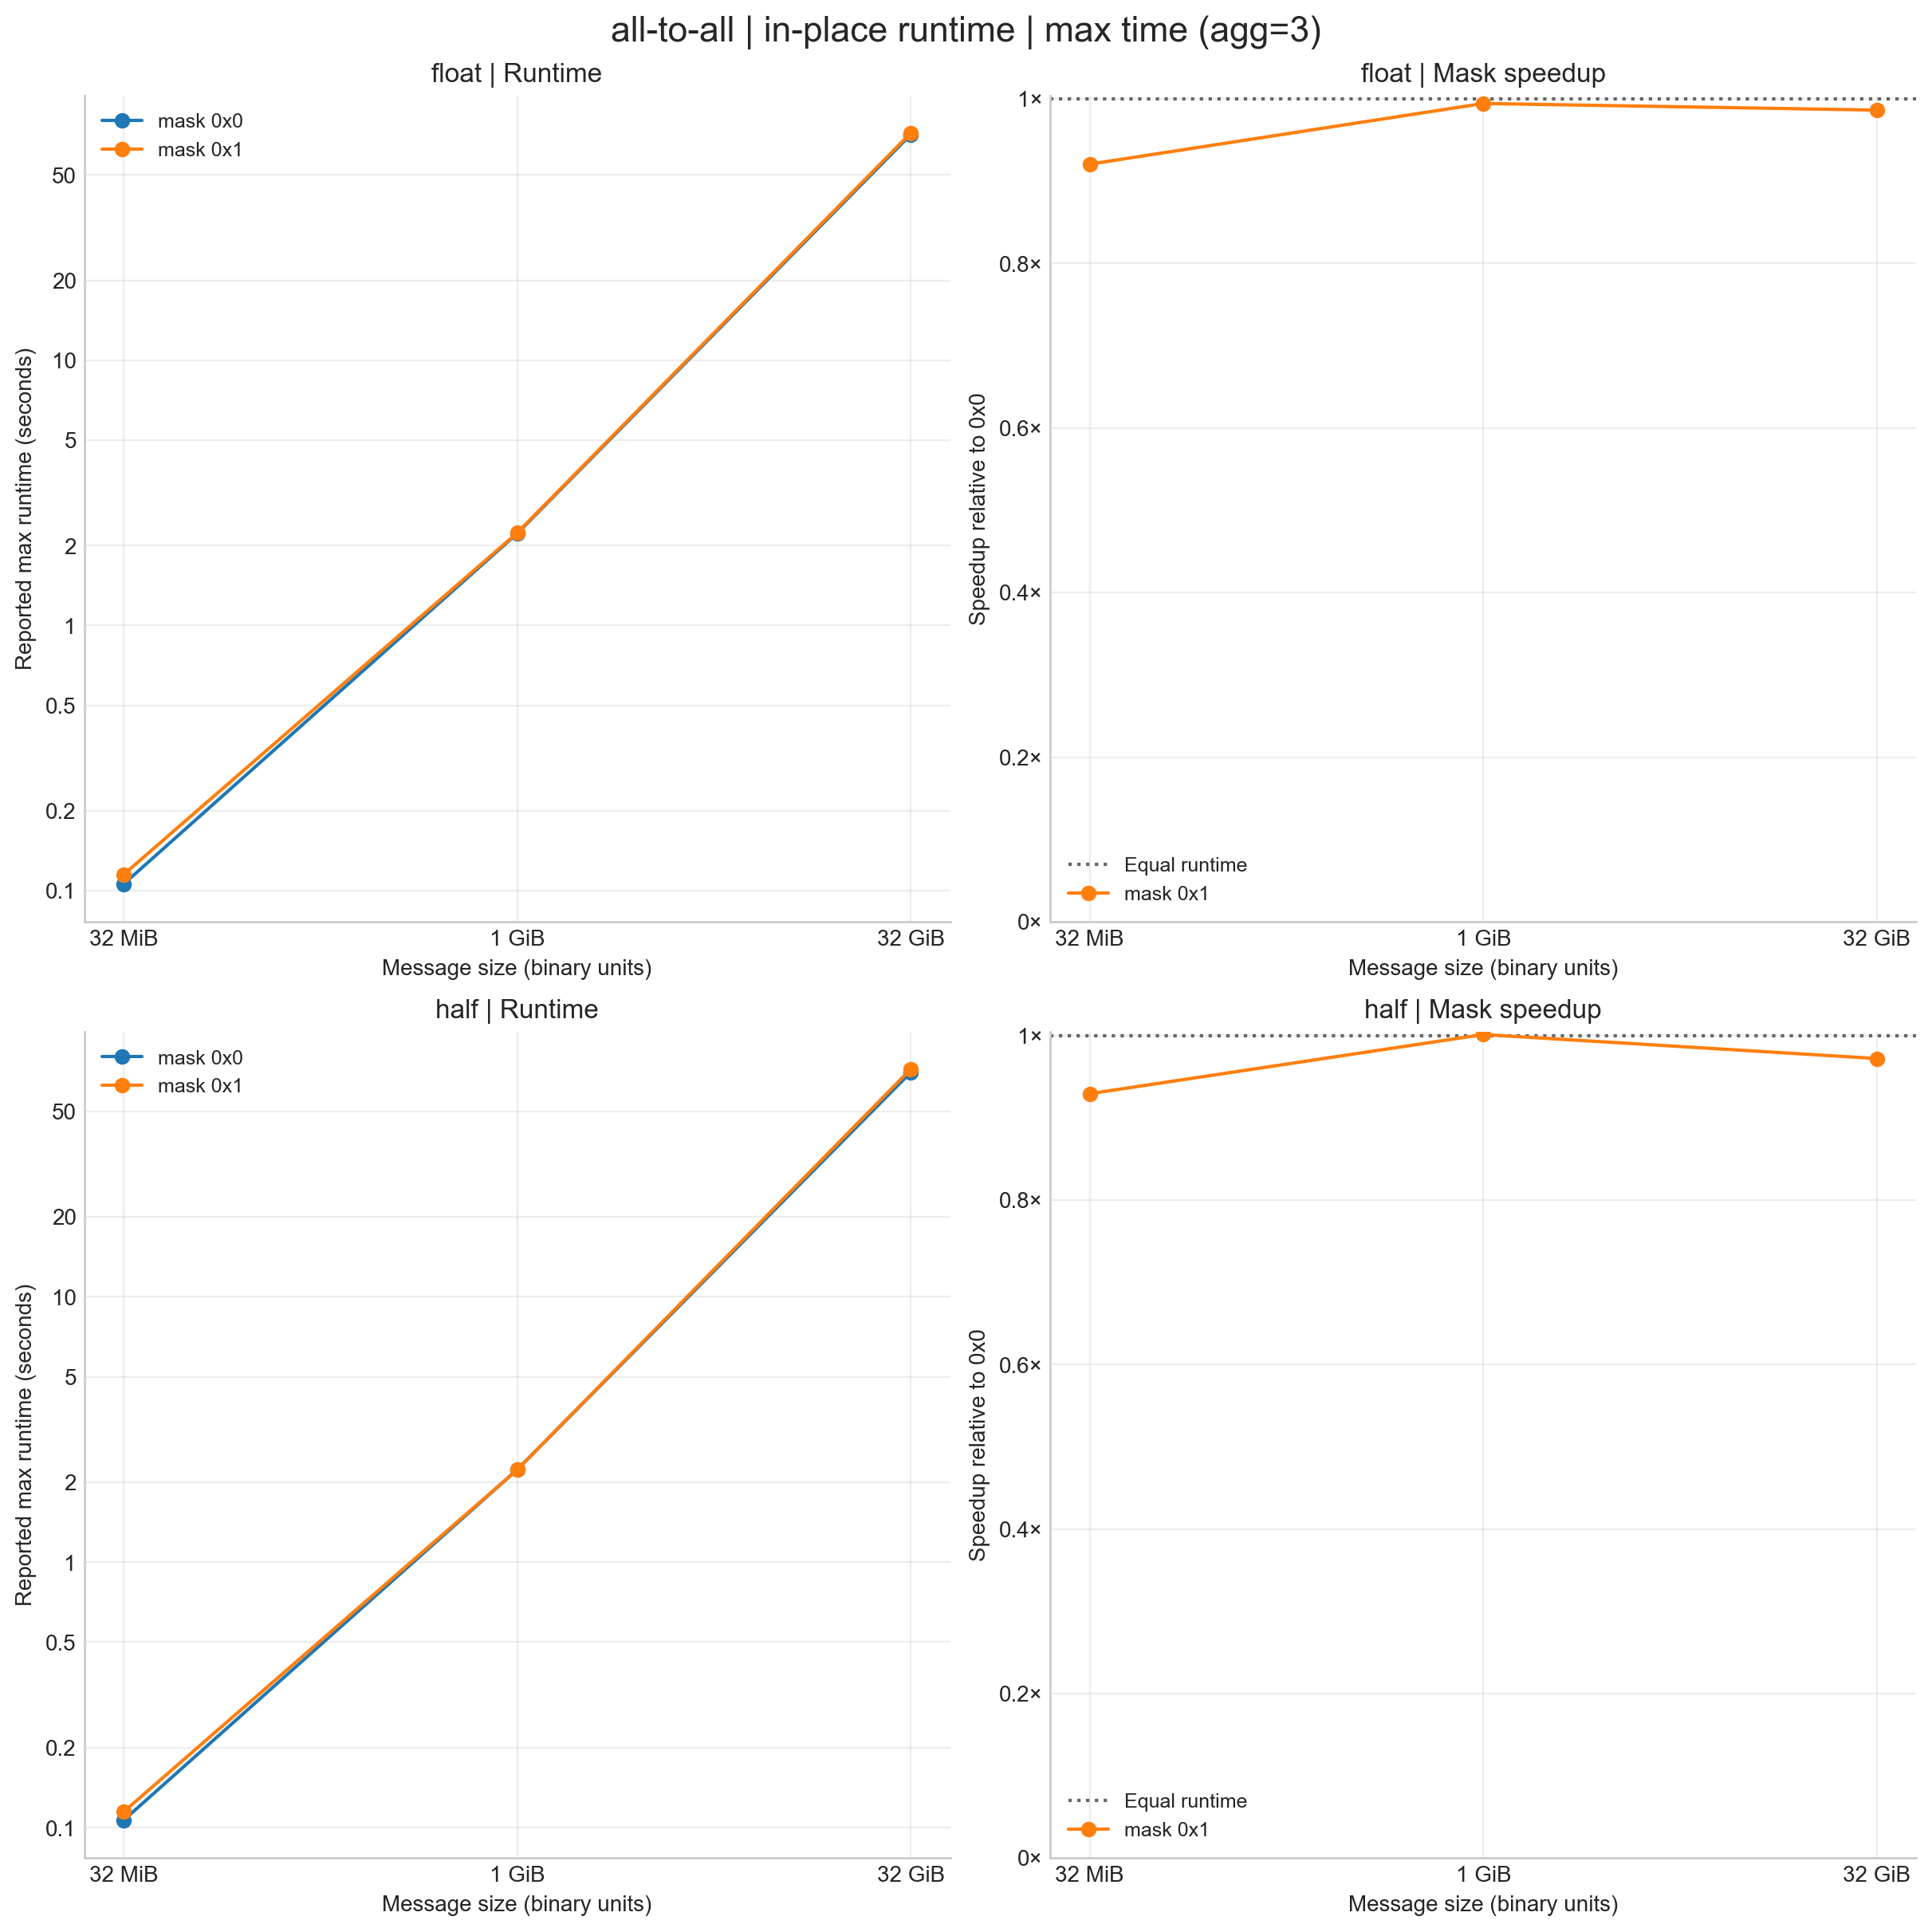
Fig. 2.17 All-to-all runtime and speedup relative to single group (0x0).
2.3.2.7. Performance projections
Project the worst-case (maximum) latency on one SU of the proposed system for each operation, data type, message size, and communicator configuration specified below. Report latency in seconds; lower is better. The El Capitan reference configuration is one SU comprising 384 nodes.
2.3.2.7.1. Required parameters
Parameter |
Required coverage |
|---|---|
System scale |
One SU of the proposed system. One SU is 384 nodes on El Capitan. |
Operations and data types |
Every combination in Problem. |
Message sizes |
The sizes listed for each operation in Problem, including
the selected |
Communicators |
Both unpartitioned and partitioned communicators. The El Capitan results use the configurations in Communicator masks. |
Reported metric |
Worst-case (maximum) latency for each test case. |
2.3.2.7.2. Reporting
For each projected system configuration, report:
The node and accelerator counts, ranks per node, total rank count, and rank-to-accelerator mapping.
The communicator grouping and number of ranks per communicator.
The hardware, system software, communication library and test-suite versions, build options, and execution environment.
The buffer mode, timed iteration count, warmup count, and timing aggregation used for the measurements supporting the projection.
Any source-code modifications, following Run Rules Synopsis.
Identify the measurements used to support each projection and describe the extrapolation or estimation method and its assumptions. When using the El Capitan results above, identify the operation, data type, message size, and mask used for the comparison.