SSAPy by Example
from ssapy import *
import numpy as np
Set an initial astropy time object
t0 = Time("2024-1-1")
print(t0)
2024-01-01 00:00:00.000
Get the position and velocity of the Moon.
r_moon = get_body("moon").position(t0).T
v_moon = (r_moon - get_body("moon").position(t0 + 1).T) / 2
print(r_moon, v_moon)
[-3.67980873e+08 1.42721025e+08 8.93144235e+07], [13379651.47831511 35015714.2905997 18263361.07635442]
Get a starting position and velocity (statevector) for an orbit. This is a Lunar bound orbit.
r0 = r_moon[0] + (1000e3 * r_moon[0] / np.linalg.norm(r_moon[0]))
v0 = v_moon[0] + 100
print(r0, v0)
-368980873.0925871 13379751.478315115
Initialize an orbit object.
a = constants.RGEO
e = 0
i = np.radians(45)
pa = np.radians(0)
raan = np.radians(0)
ta = np.radians(180)
kElements = [a, e, i, pa, raan, ta] orbit = Orbit.fromKeplerianElements(*kElements, t=t0)
Set parameters of the satellite
sat_kwargs = dict(
        mass=100,  # [kg]
        area=1,  # [m^2]
        CD=2.3,  # Drag coefficient
        CR=1.3,  # Radiation pressure coefficient
)
Build a propagator and set custom accelerations.
moon = get_body("moon")
sun = get_body("Sun")
Mercury = get_body("Mercury")
Venus = get_body("Venus")
Earth = get_body("Earth", model="EGM2008")
Mars = get_body("Mars")
Jupiter = get_body("Jupiter")
Saturn = get_body("Saturn")
Uranus = get_body("Uranus")
Neptune = get_body("Neptune")
aEarth = AccelKepler() + AccelHarmonic(Earth, 140, 140)
aSun = AccelThirdBody(sun)
aMoon = AccelThirdBody(moon) + AccelHarmonic(moon, 20, 20)
aSolRad = AccelSolRad(**sat_kwargs)
aEarthRad = AccelEarthRad(**sat_kwargs)
accel = aEarth + aMoon + aSun + aSolRad + aEarthRad
prop = SciPyPropagator(accel)
Build a time array to evaluate the orbit at
times = utils.get_times(duration=(2, 'day'), freq=(1, 'minute'), t0=t0)
r, v = rv(orbit=orbit, time=times, propagator=prop)
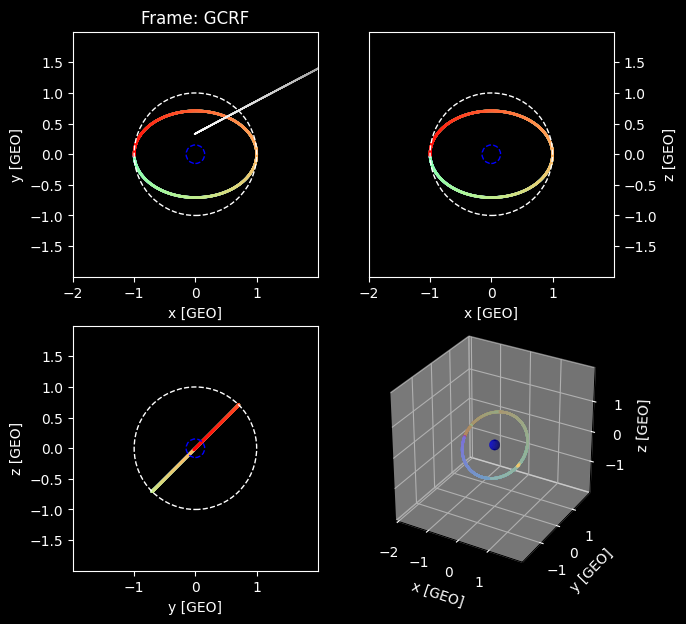
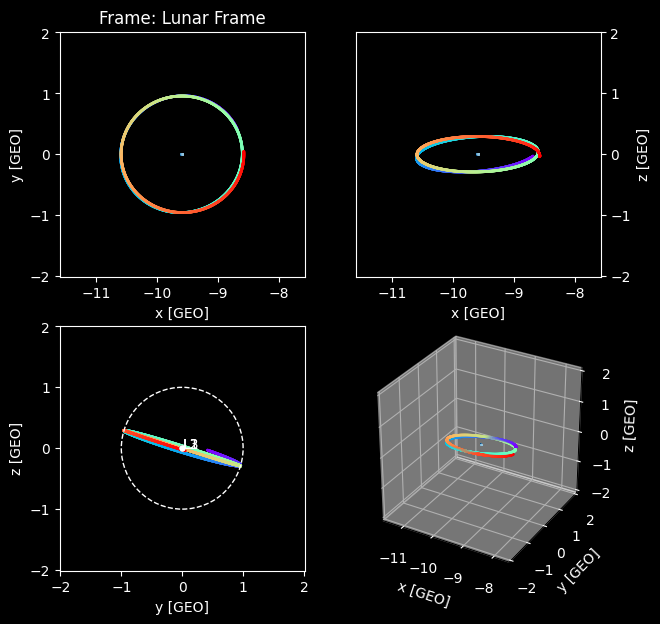
Plot the output in a GCRF (star fixed frame) and lunar (a non-interial Earth-Moon fixed frame)
plotUtils.orbit_plot(r, times, frame="gcrf", show=True)
plotUtils.orbit_plot(r, times, frame="lunar", show=True)
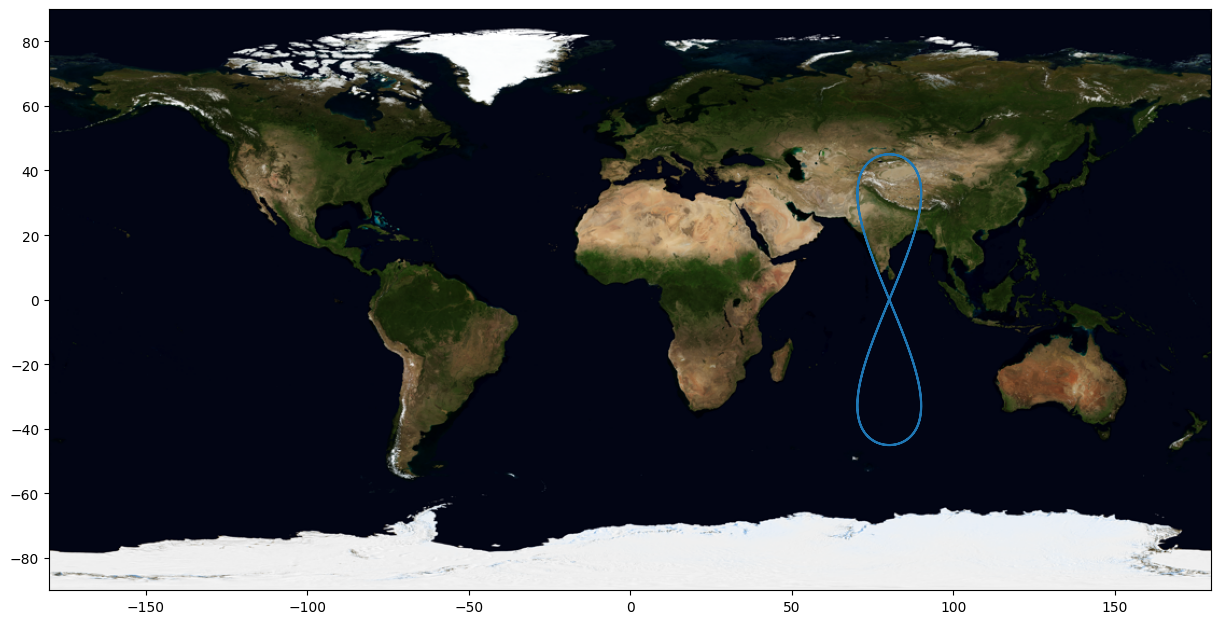
Lets see a ground track of the orbit.
plotUtils.ground_track_plot(r, times)
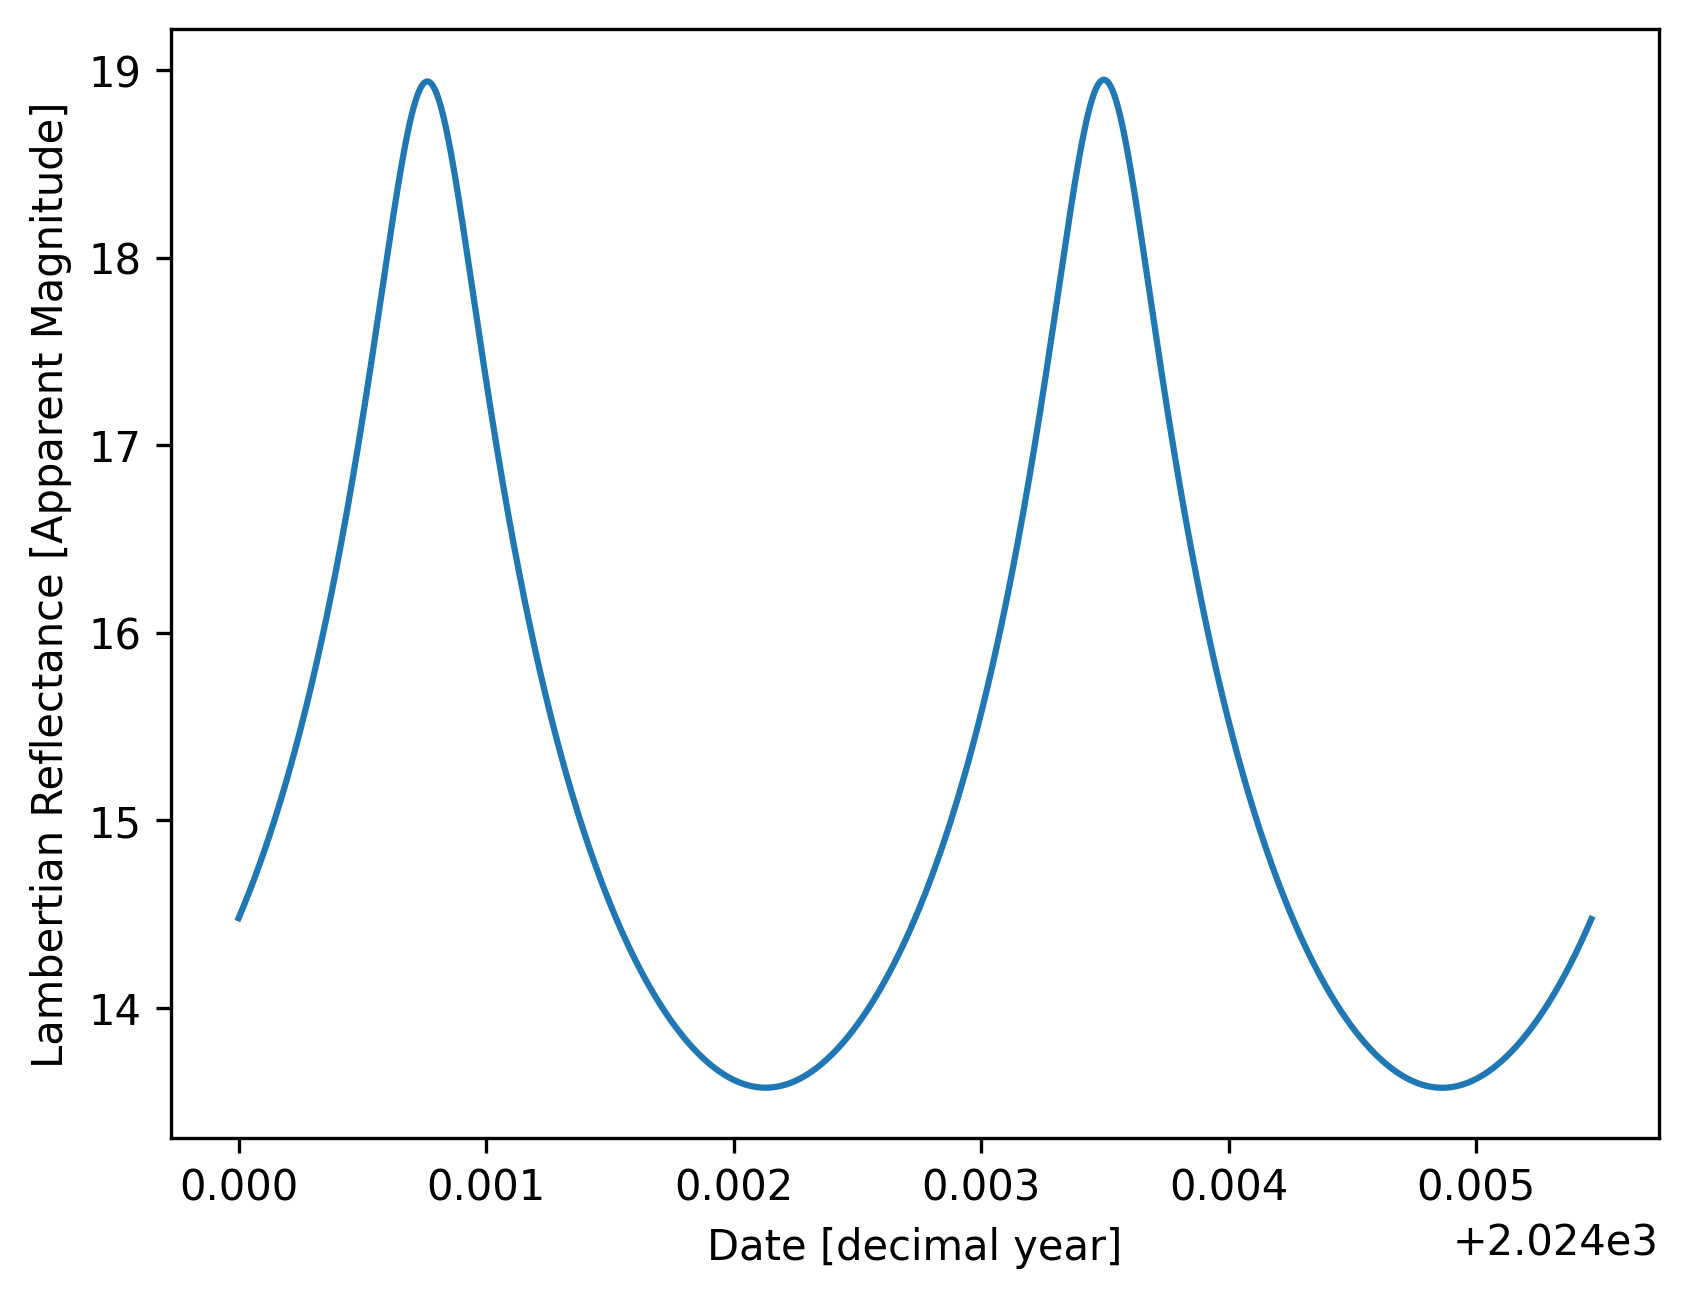
Calculate the Lambertian Reflectance of the orbit
mv = compute.M_v_lambertian(r, times)
import matplotlib.pyplot as plt

def decimal_to_datetime_label(d):
    year = int(d)
    rem = d - year
    is_leap = year % 4 == 0 and (year % 100 != 0 or year % 400 == 0)
    days_in_year = 366 if is_leap else 365
    total_seconds = rem * days_in_year * 24 * 3600

    day = int(total_seconds // (24 * 3600))
    seconds_in_day = total_seconds % (24 * 3600)
    hour = int(seconds_in_day // 3600)
    minute = int((seconds_in_day % 3600) // 60)

    base_date = np.datetime64(f'{year}-01-01') + np.timedelta64(day, 'D')
    return f"{base_date} {hour:02d}:{minute:02d}"

xticks = np.linspace(times.decimalyear[0], times.decimalyear[-1], 6)
xtick_labels = [decimal_to_datetime_label(t) for t in xticks]

plt.figure(dpi=300)
plt.plot(times.decimalyear, mv)
plt.xlabel("Date")
plt.ylabel("Lambertian Reflectance [Apparent Magnitude]")
plt.xticks(xticks, xtick_labels, rotation=45)
plt.tight_layout()
plt.show()
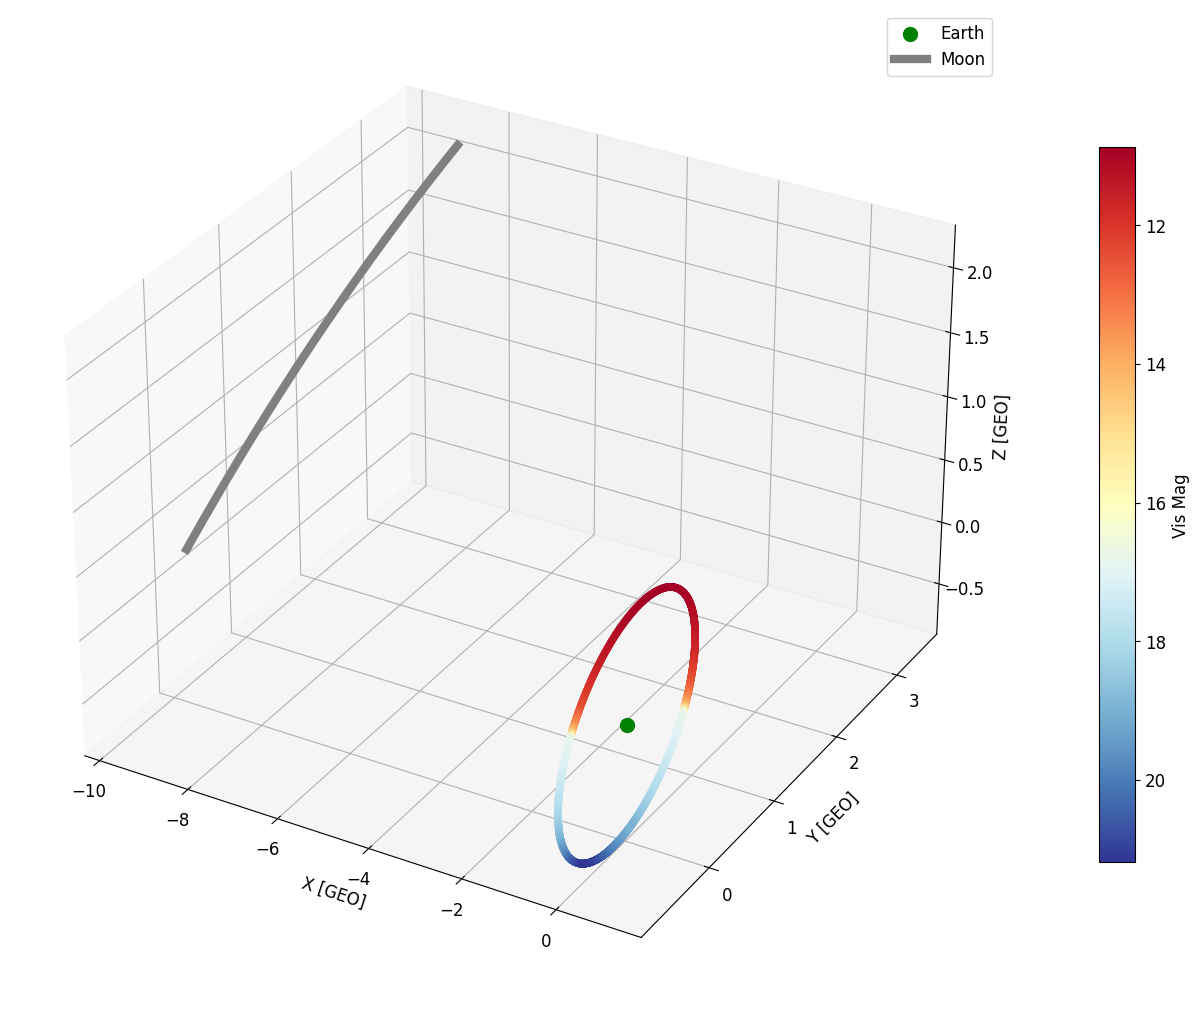
Plot the apparent magnitude of the orbit at each timestep:
r_sun = get_body("sun").position(times).T
r_earth = get_body("earth").position(times).T

# Calculate the apparent magnitude at each timestep
mags = compute.calc_M_v(r, r_sun, r_earth)

RGEO = constants.RGEO
moon = get_body("moon").position(times).T

fig = plt.figure(figsize=(12, 12), layout='constrained')
plt.rcParams.update({'font.size': 12})
ax = fig.add_subplot(projection='3d')

x = r[:, 0] / RGEO
y = r[:, 1] / RGEO
z = r[:, 2] / RGEO

# Plot orbit
scatter = ax.scatter3D(x, y, z, c=mags, cmap='RdYlBu')

cbar = fig.colorbar(scatter, ax=ax, shrink=0.6, aspect=20, pad=0.1, orientation='vertical')
cbar.set_label('Vis Mag')
cbar.ax.invert_yaxis()

# Plot Earth
ax.scatter3D(0, 0, 0, color='green', label='Earth', s=100)

# Plot Moon
ax.plot(moon[:, 0] / RGEO, moon[:, 1] / RGEO, moon[:, 2] / RGEO, color='gray', label='Moon', lw=6)

ax.set_xlabel('X [GEO]')
ax.set_ylabel('Y [GEO]')
ax.set_zlabel('Z [GEO]')

plt.legend()
plt.show()
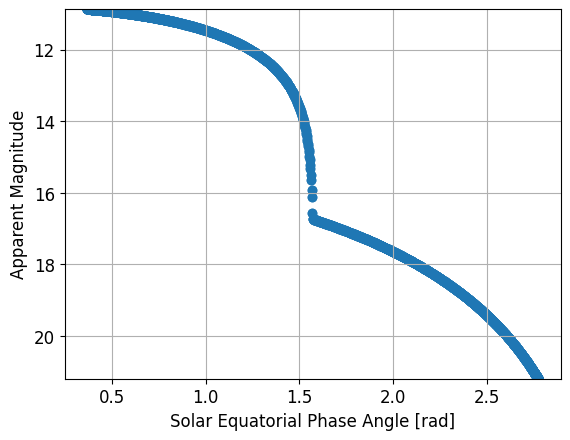
Plot the solar phase angle at each timestep:
sun_angle=compute.get_angle(r_sun,r,r_earth)

plt.scatter(sun_angle,mags)
plt.xlabel('Solar Equatorial Phase Angle [rad]')
plt.ylabel('Apparent Magnitude')
plt.ylim(max(mags), min(mags))
plt.grid()
plt.show()