Event tracing and timelines
Event tracing allows detailed analysis of individual region instances and the
generation of timeline views. Use the event-trace config to generate event
traces. It will produce a .cali trace file for each process.
$ CALI_CONFIG=event-trace ./examples/apps/cxx-example
$ ls
221123-174219_31239_YVnF2l7pSQes.cali
There are a variety of options for event-trace. Use
cali-query --help event-trace to show all available options. A few useful
ones are:
- trace.mpi
Trace MPI functions. Requires MPI support in Caliper.
- trace.openmp
Trace OpenMP constructs such as parallel regions, loops, and barriers. Requires OMPT support in Caliper.
- trace.cuda
Trace host-side CUDA API calls like cudaMemcpy. Requires CUpti support in Caliper.
- cuda.activities
Trace CUDA device-side activities such as kernel executions. Requires CUpti support in Caliper.
- rocm.activities
Trace HIP activities (kernel executions etc.) and host-side HIP API calls (like hipMemcpy). Requires ROCm support in Caliper.
Timeline visualization (experimental)
The python subdirectory in the Caliper repository contains the
cali2traceevent.py script, which converts the .cali trace files written
by Caliper’s event-trace config into Google’s TraceEvent JSON format that
can be loaded by Google Chrome’s built-in trace visualizer or in
Perfetto.
Note that the TraceEvent JSON format does not scale particularly well, so it
is not advisable to use it for large traces (say, more than O(1M) events).
To use the script, add the caliper-reader Python module to PYTHONPATH.
You also find it in the python subdirectory in the Caliper repository.
Pass your .cali files and the output json file name as arguments to the
script:
$ export PYTHONPATH=<caliper-source-dir>/python/caliper-reader
$ export PATH=$PATH:<caliper-source-dir>/python
$ cali2traceevent.py *.cali trace.json
Done. 0.00s (0.00s processing, 0.00s write).
11 records written, 0 skipped.
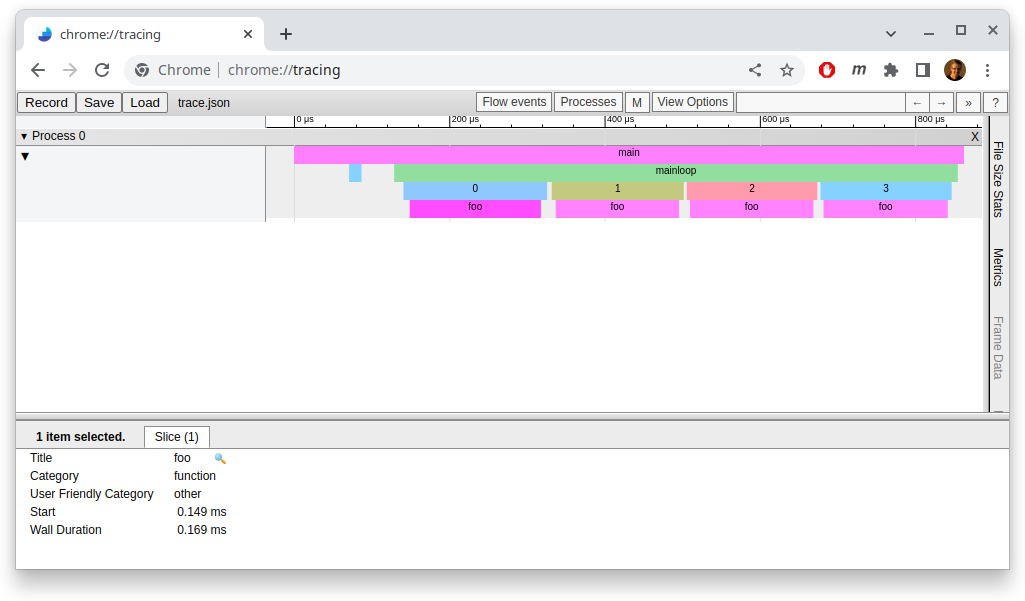
You can then load the generated JSON trace file in the Google Chrome by going
to chrome://tracing:

An example Caliper trace timeline visualization in Google Chrome.
